Summary
- Trust in the New Zealand Police has been increasing since 2017.
- Willingness to engage with the police is high but declining.
- There was no change in willingness to engage with the police during the March/April 2020 lockdown.
- There was a boost to this trust during the March/April 2020 lockdown.
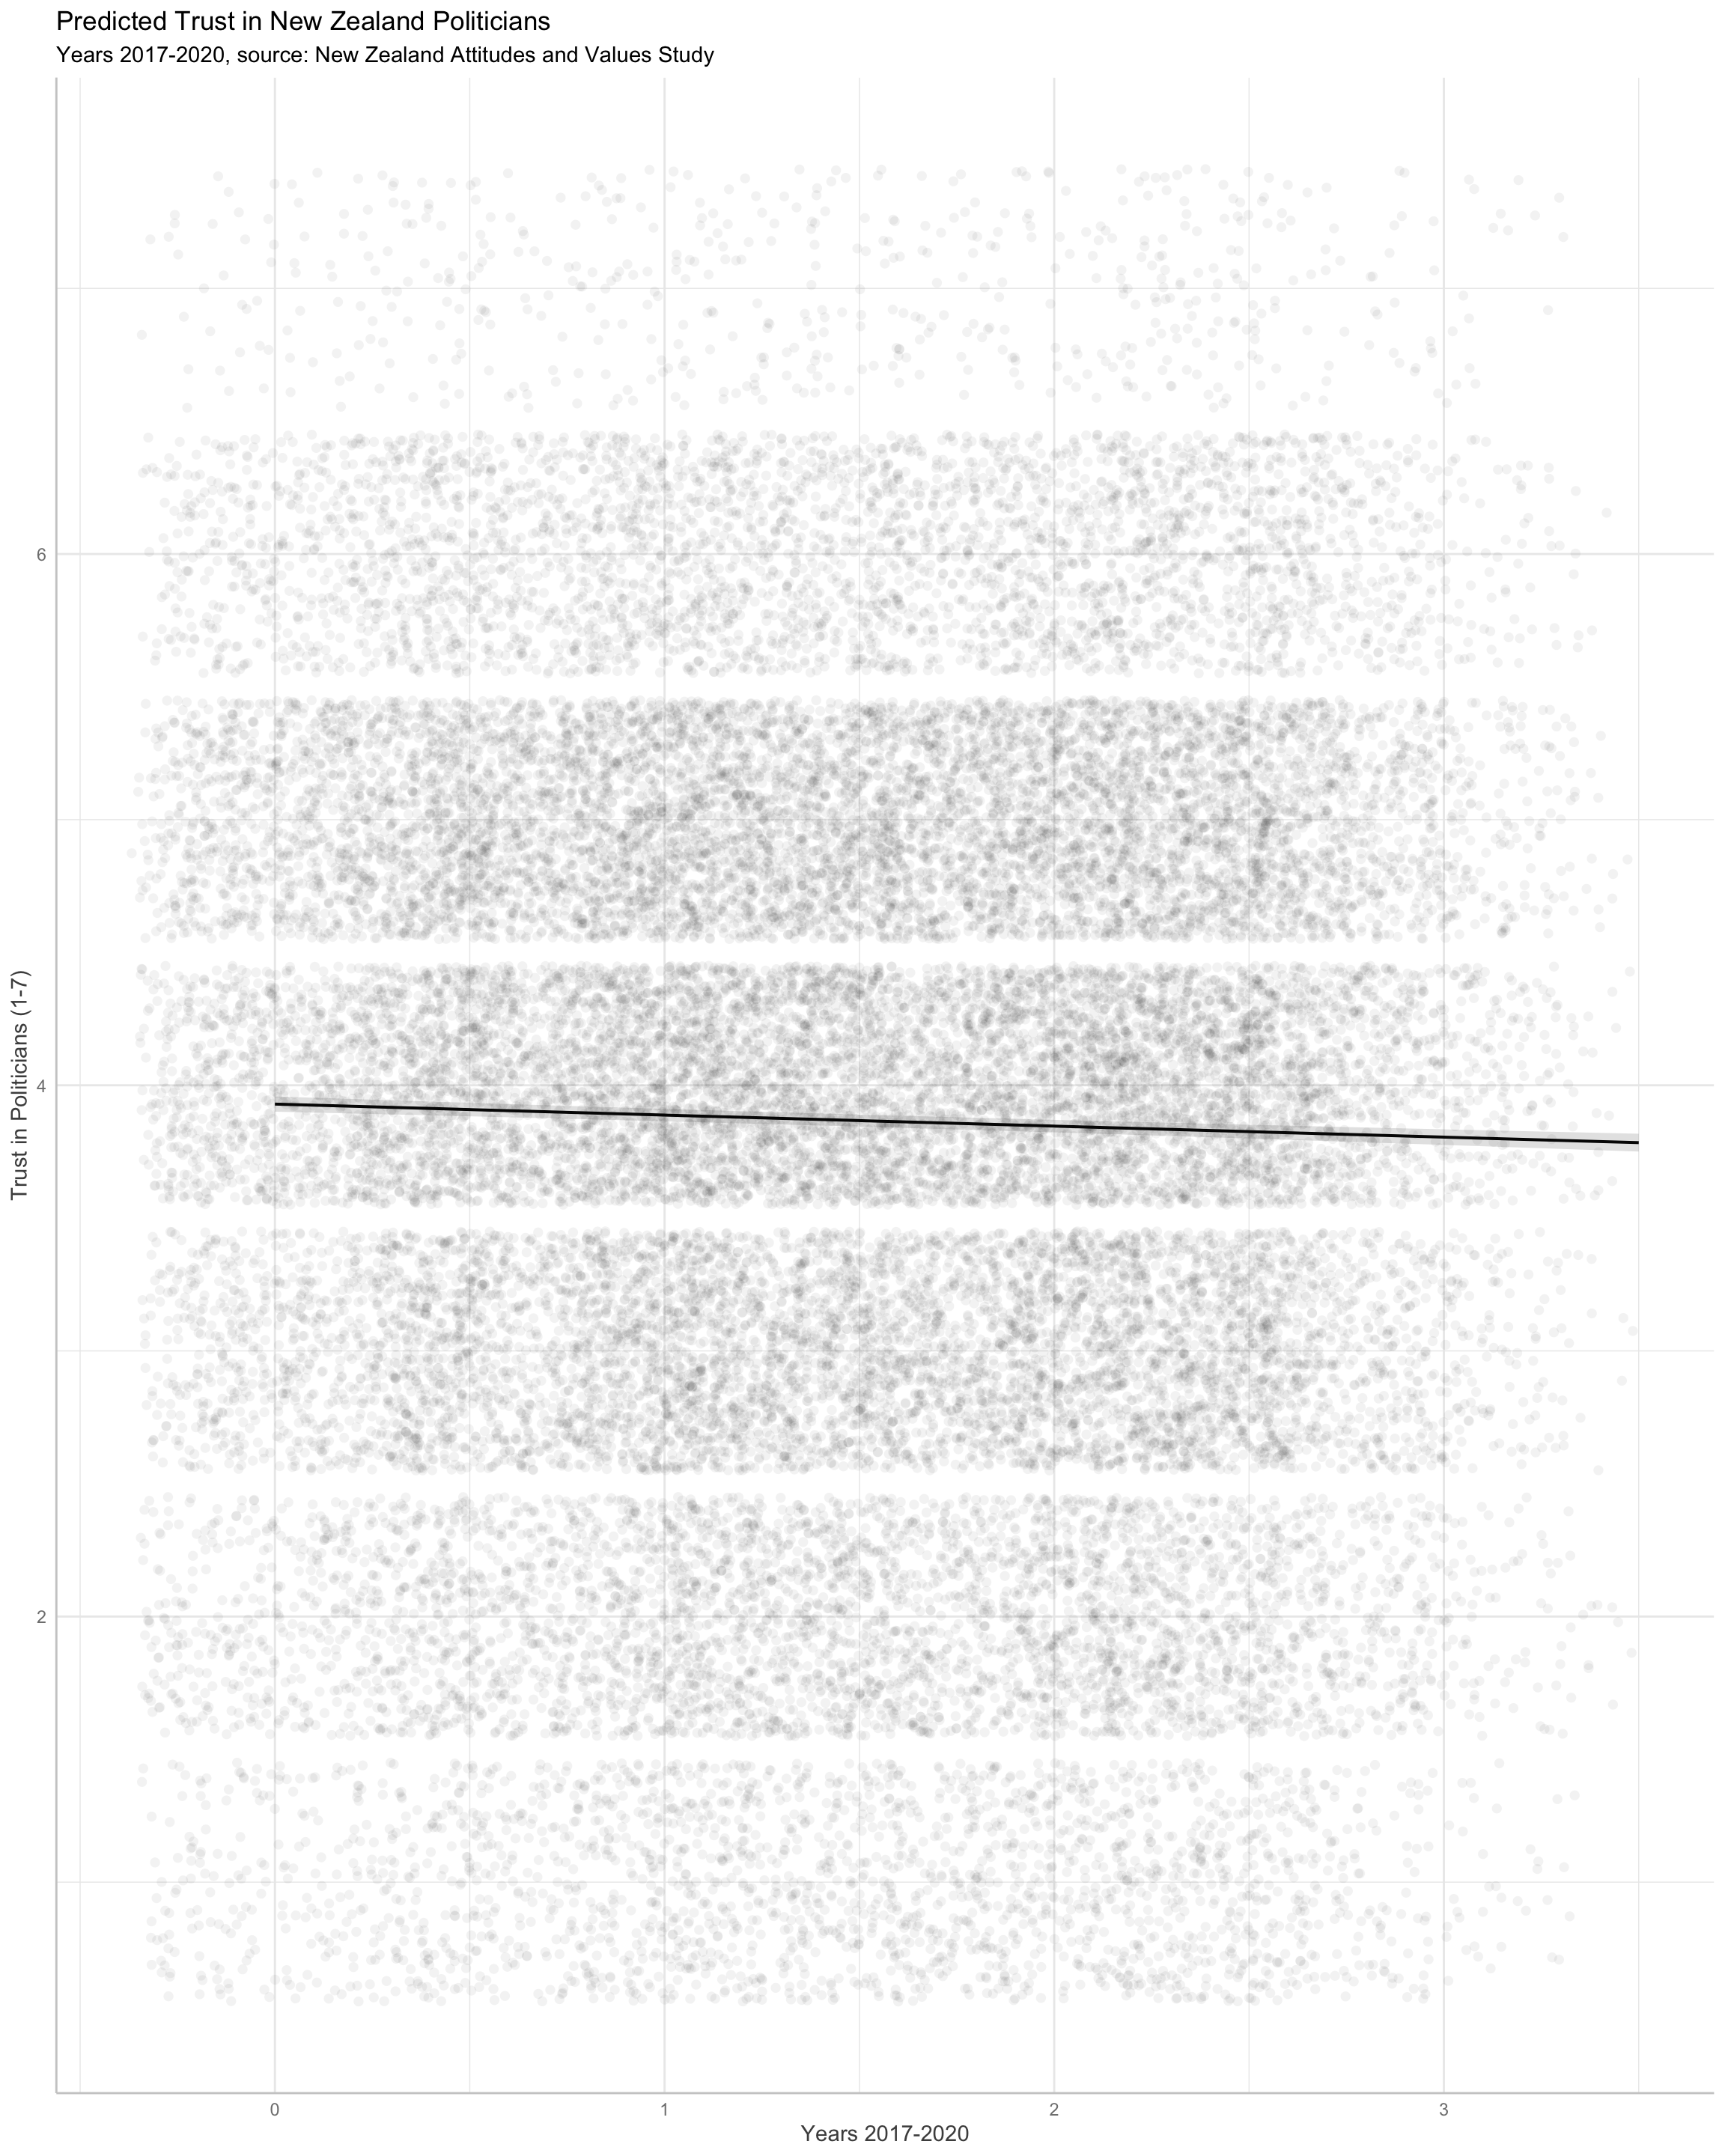
- By comparison, trust in New Zealand politicians has been decreasing since 2017.
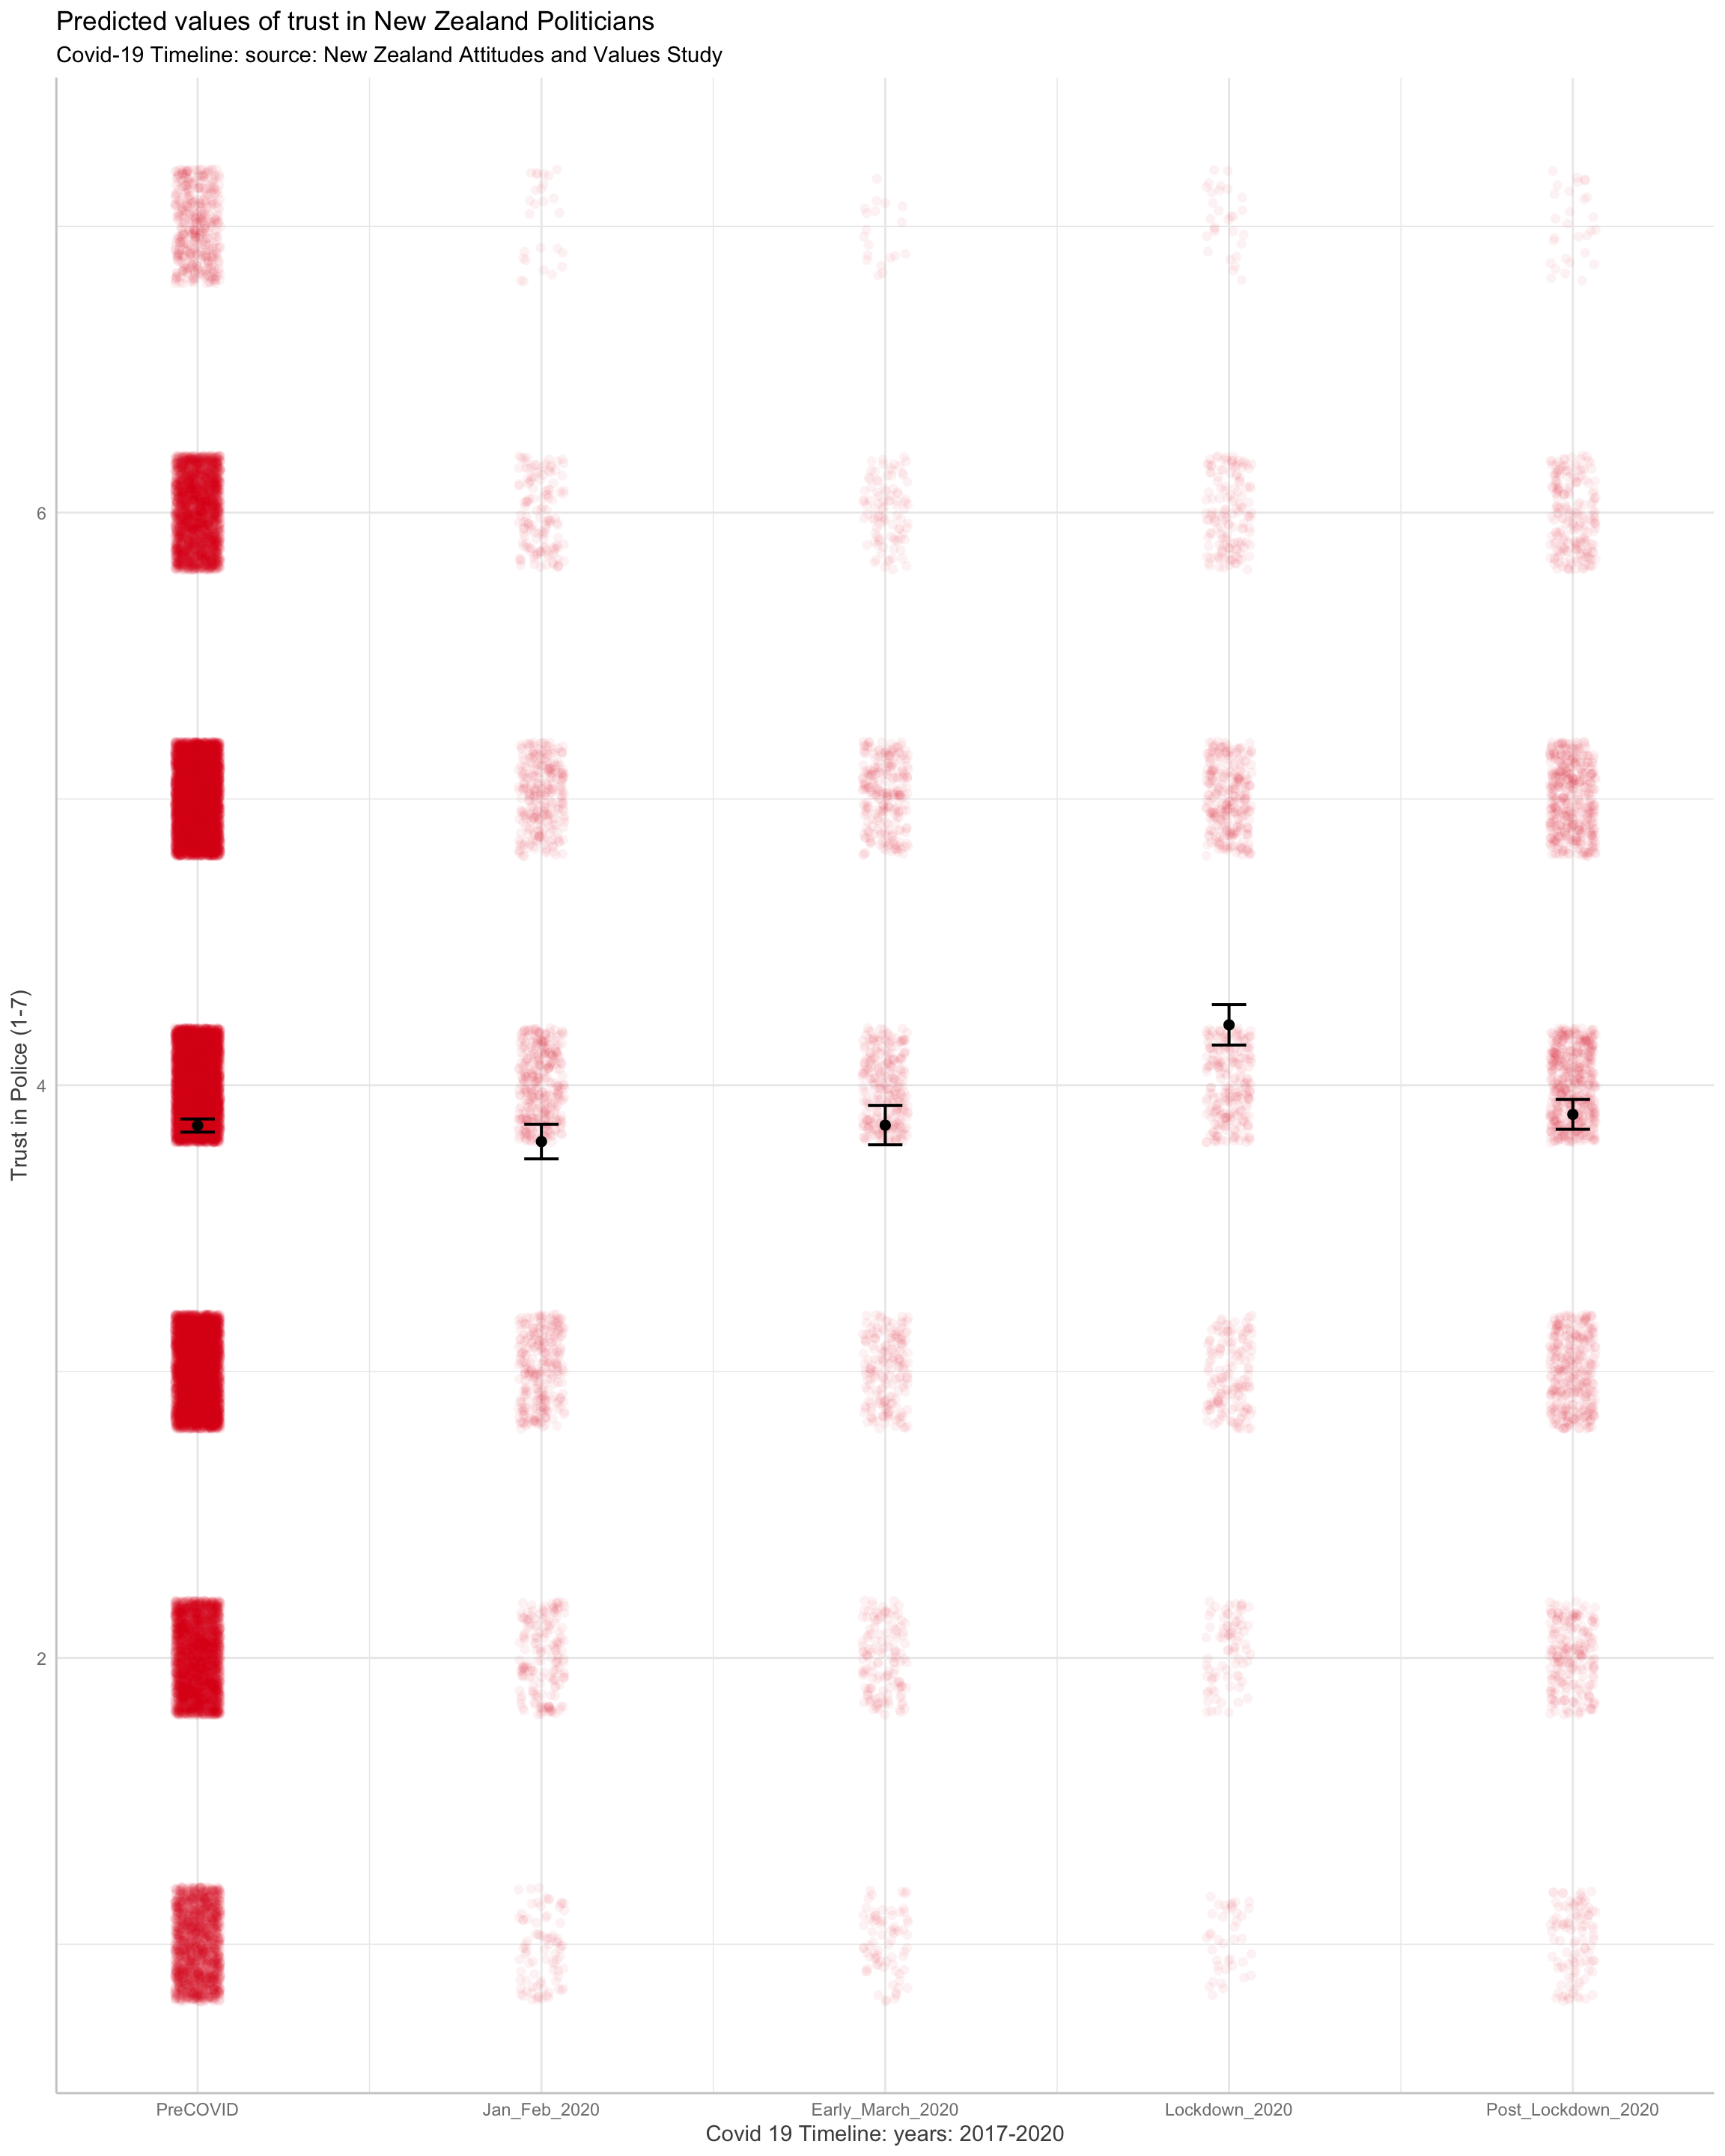
- There was a strong increase in trust in politicians during the March/April 2020 lockdown, which has since declined.
- Overall, New Zealanders trust their police more than they trust their politicians, and if anything, trust is growing.
Introduction
Here, we investigate stability in change in attitudes to the New Zealand Police and to New Zealand politicians using longitudinal responses from the New Zealand Attitudes and Values Study (NZAVS).
The NZAVS is a panel study. A panel study is a longitudinal study that follows the same individuals over time. A panel study is different from a census, which samples the population as a whole over time, without tracking individuals. Time-series data within the same individuals across a diverse population are powerful because they enable a systematic understanding of the complex interplay between human social and psychological processes that occur within people over time. The NZAVS is distinct from other national panel studies for the breadth of its survey questions, which includes measures of attitudes to the police, for the representativeness of its sample, made possible from sampling from New Zealand’s electoral role, and for the high-level of year-to-year sample retention, which is ~80%.
For more information about the NZAVS see here and here
Questions
The NZAVS uses a three item scale to assess institutional trust in the NZ police. The items are as follows:
- People’s basic rights are well protected by the New Zealand Police.
- There are many things about the New Zealand Police and its policies that need to be changed (reverse scored).
- The New Zealand Police care about the well-being of everyone they deal with.
The NZAVS also uses a two-item scale to assess wiliness to engage with the police. The items in this scale are as follows:
- I would always report dangerous or suspicious activities occurring in my neighbourhood to the police.
- I would always provide information to the police to help them find someone suspected of committing a crime.
These scales appeared in NZAVS Wave 7 (2015/16), Wave 9 (2017/18), Wave 10 (2018/19), and Wave 11 (2019/20).
To disentangle police-specific distrust from other forms of institutional trust, we also include a measure of trust in politicians.
- Politicians in New Zealand can generally be trusted.
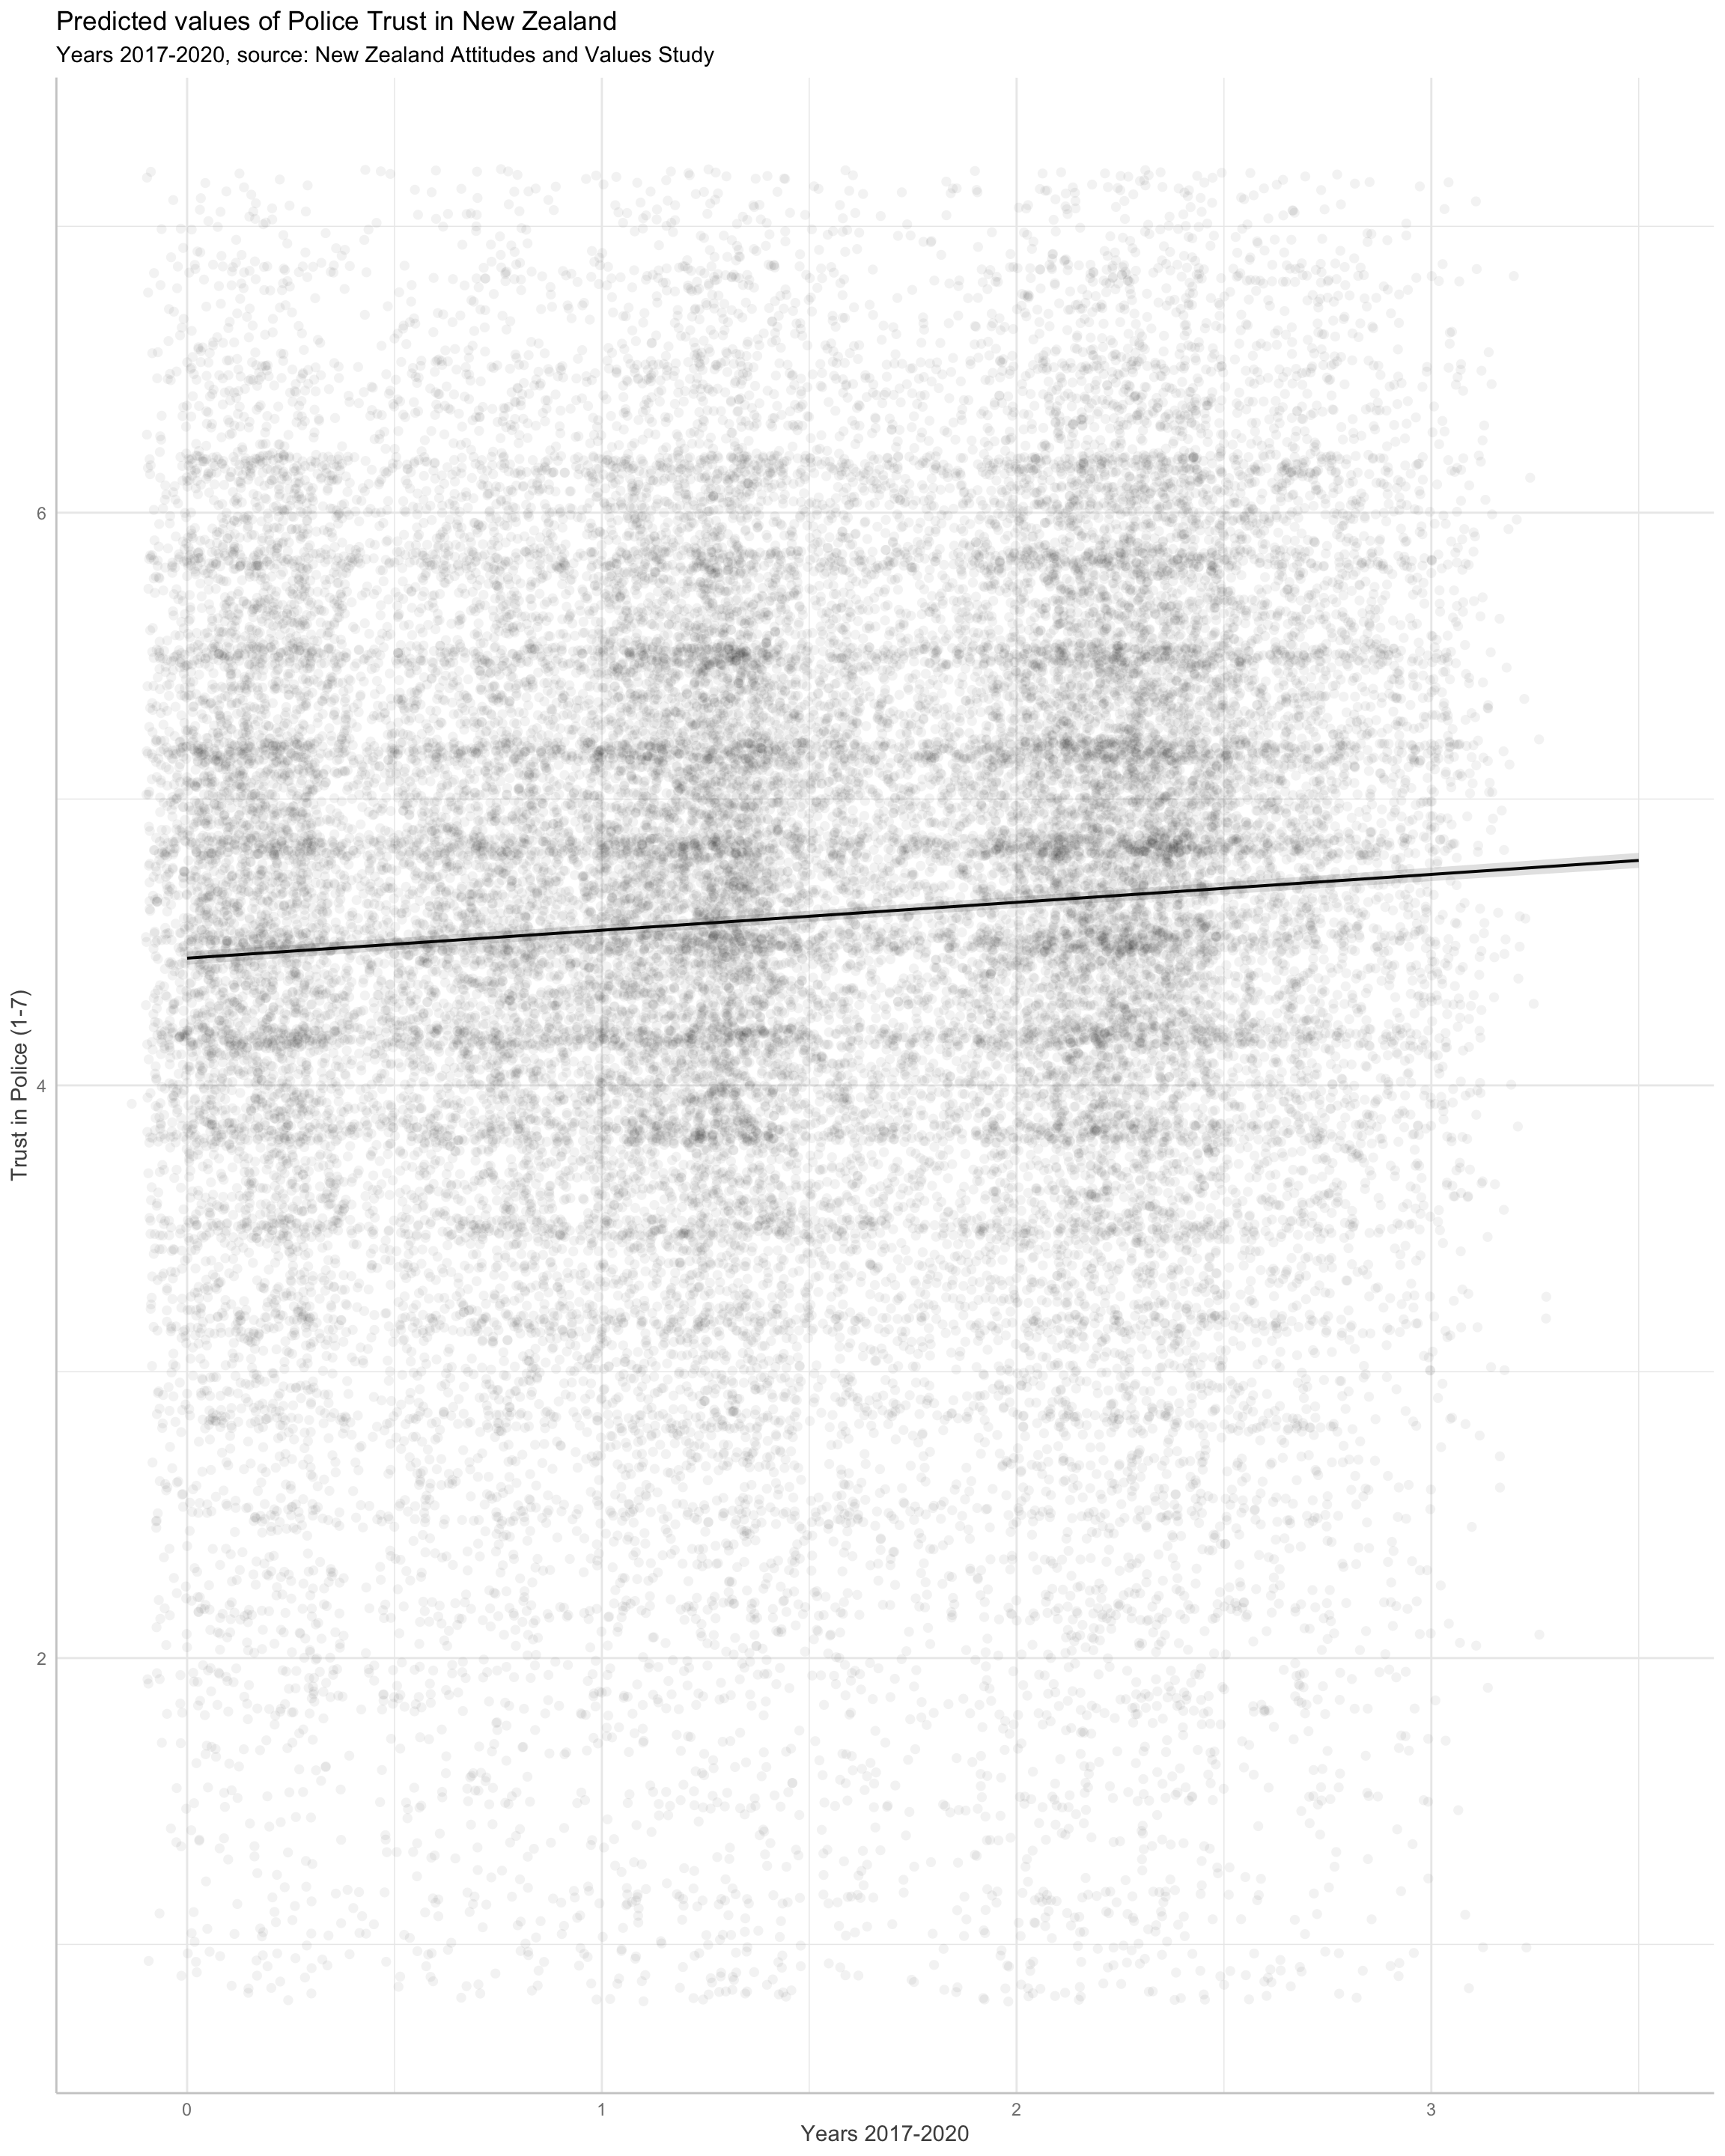
Trust in the New Zealand police has been increasing since 2017.
First, we model the time trend for trust in the New Zealand police since 2017.
We find that since 2017, trust in the New Zealand police has been increasing within New Zealanders.
Show code
pt <-lme4::lmer(Police_Trust ~ year_s  + (1|Id), data = pd)
parameters::model_parameters(pt) %>%
  parameters::print_html(
      caption = "data from the New Zealand Attitudes and Values Study",
      title = "Trust in New Zealand Police: years 2017-2020")
| Trust in New Zealand Police: years 2017-2020 | |||||
|---|---|---|---|---|---|
| Parameter | Coefficient | SE | 95% CI | t(34231) | p |
| Fixed Effects | |||||
| (Intercept) | 4.44 | 0.01 | (4.42, 4.47) | 377.87 | < .001 |
| year s | 0.10 | 4.46e-03 | (0.09, 0.11) | 21.88 | < .001 |
| Random Effects | |||||
| SD (Intercept: Id) | 0.98 | ||||
| SD (Residual) | 0.66 | ||||
Graphing the trend:.
Show code
pl1 <- plot(ggeffects::ggpredict(pt,
                                 effects = c("year_s")),
            add.data = TRUE,
            dot.alpha = .05)[[1]] +
  xlab("Years 2017-2020") +
  ylab("Trust in Police (1-7)") +
  labs(title = "Predicted values of Police Trust in New Zealand",
       subtitle = "Years 2017-2020, source: New Zealand Attitudes and Values Study")
pl1
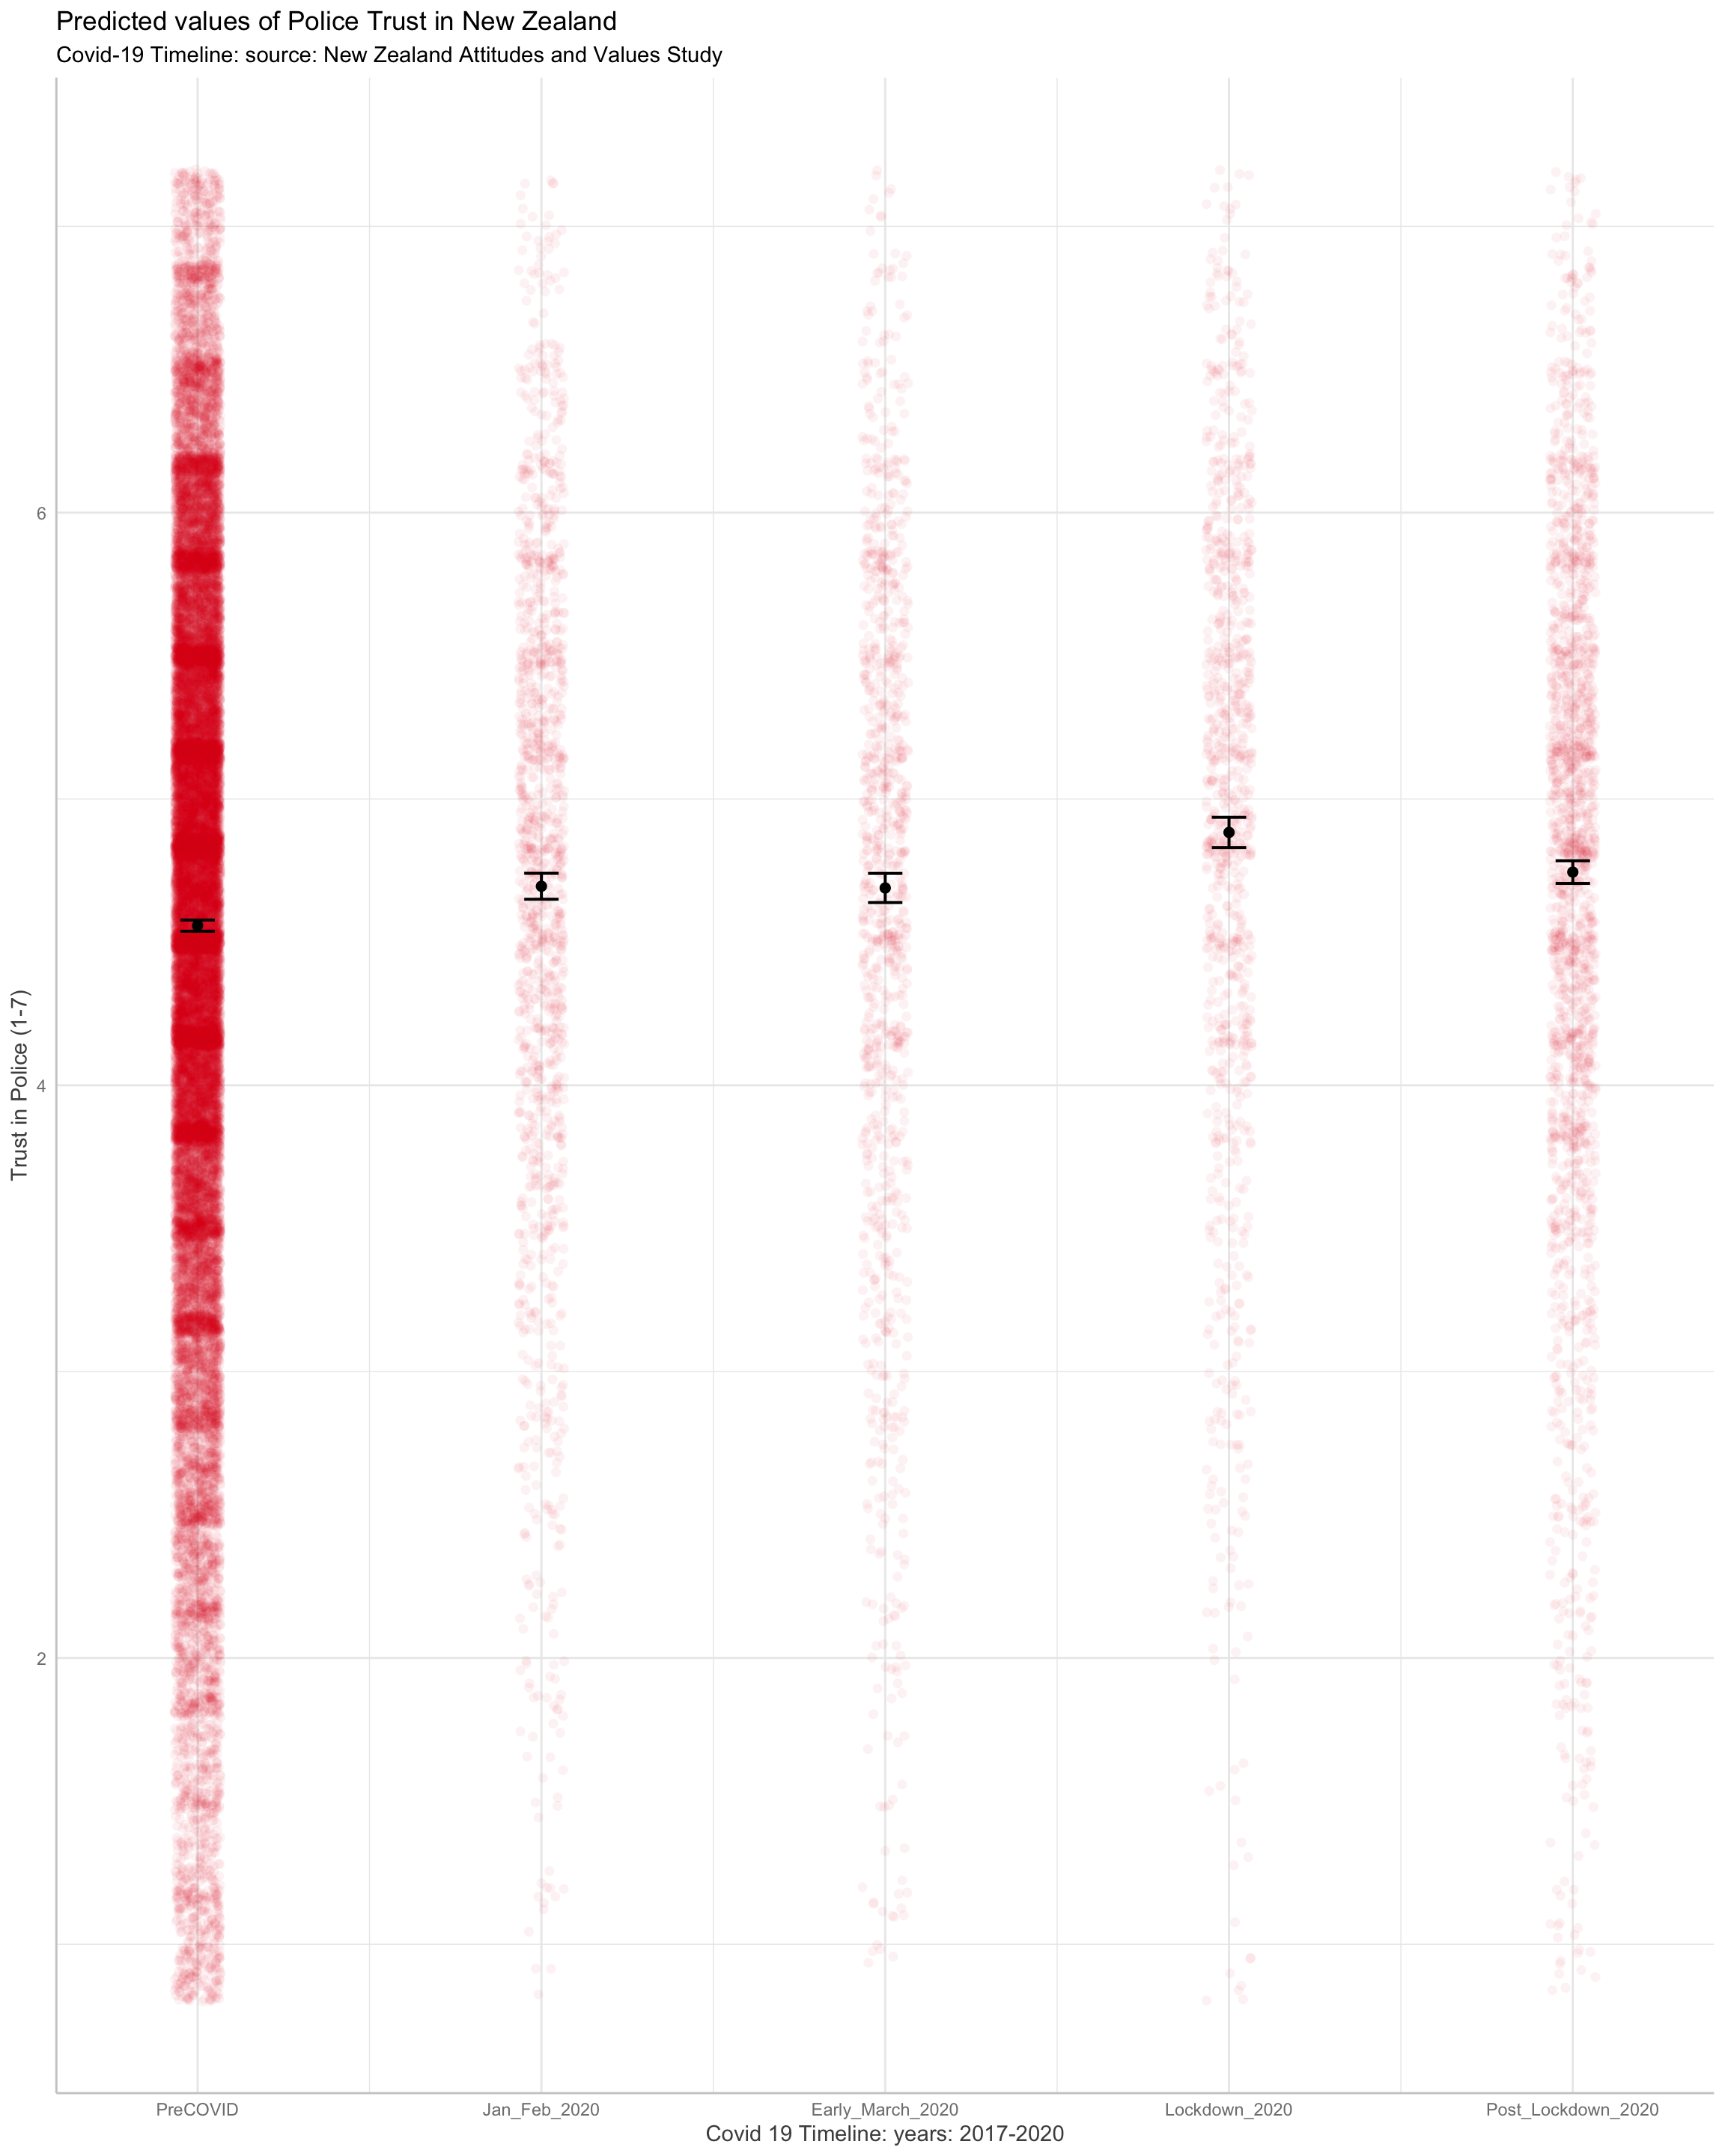
There was a boost in willingness to trust the police during New Zealand’s March/April 2020 Lockdown
Focusing on Covid specific predictions, we find a boost in trust of the New Zealand police during New Zealand’s stringent Covid-19 pandemic lockdown of late March/April 2020.
Show code
ptt <-lme4::lmer(Police_Trust ~ Covid_Timeline  + (1|Id), data = pd)
pl1_b <- plot(
  ggeffects::ggpredict(ptt,
                       effects = c("Covid_Timeline")),
  add.data = TRUE,
  dot.alpha = .05
)[[1]] +
  xlab("Covid 19 Timeline: years: 2017-2020") +
  ylab("Trust in Police (1-7)") +
  labs(title = "Predicted values of Police Trust in New Zealand",
       subtitle = "Covid-19 Timeline: source: New Zealand Attitudes and Values Study")
pl1_b
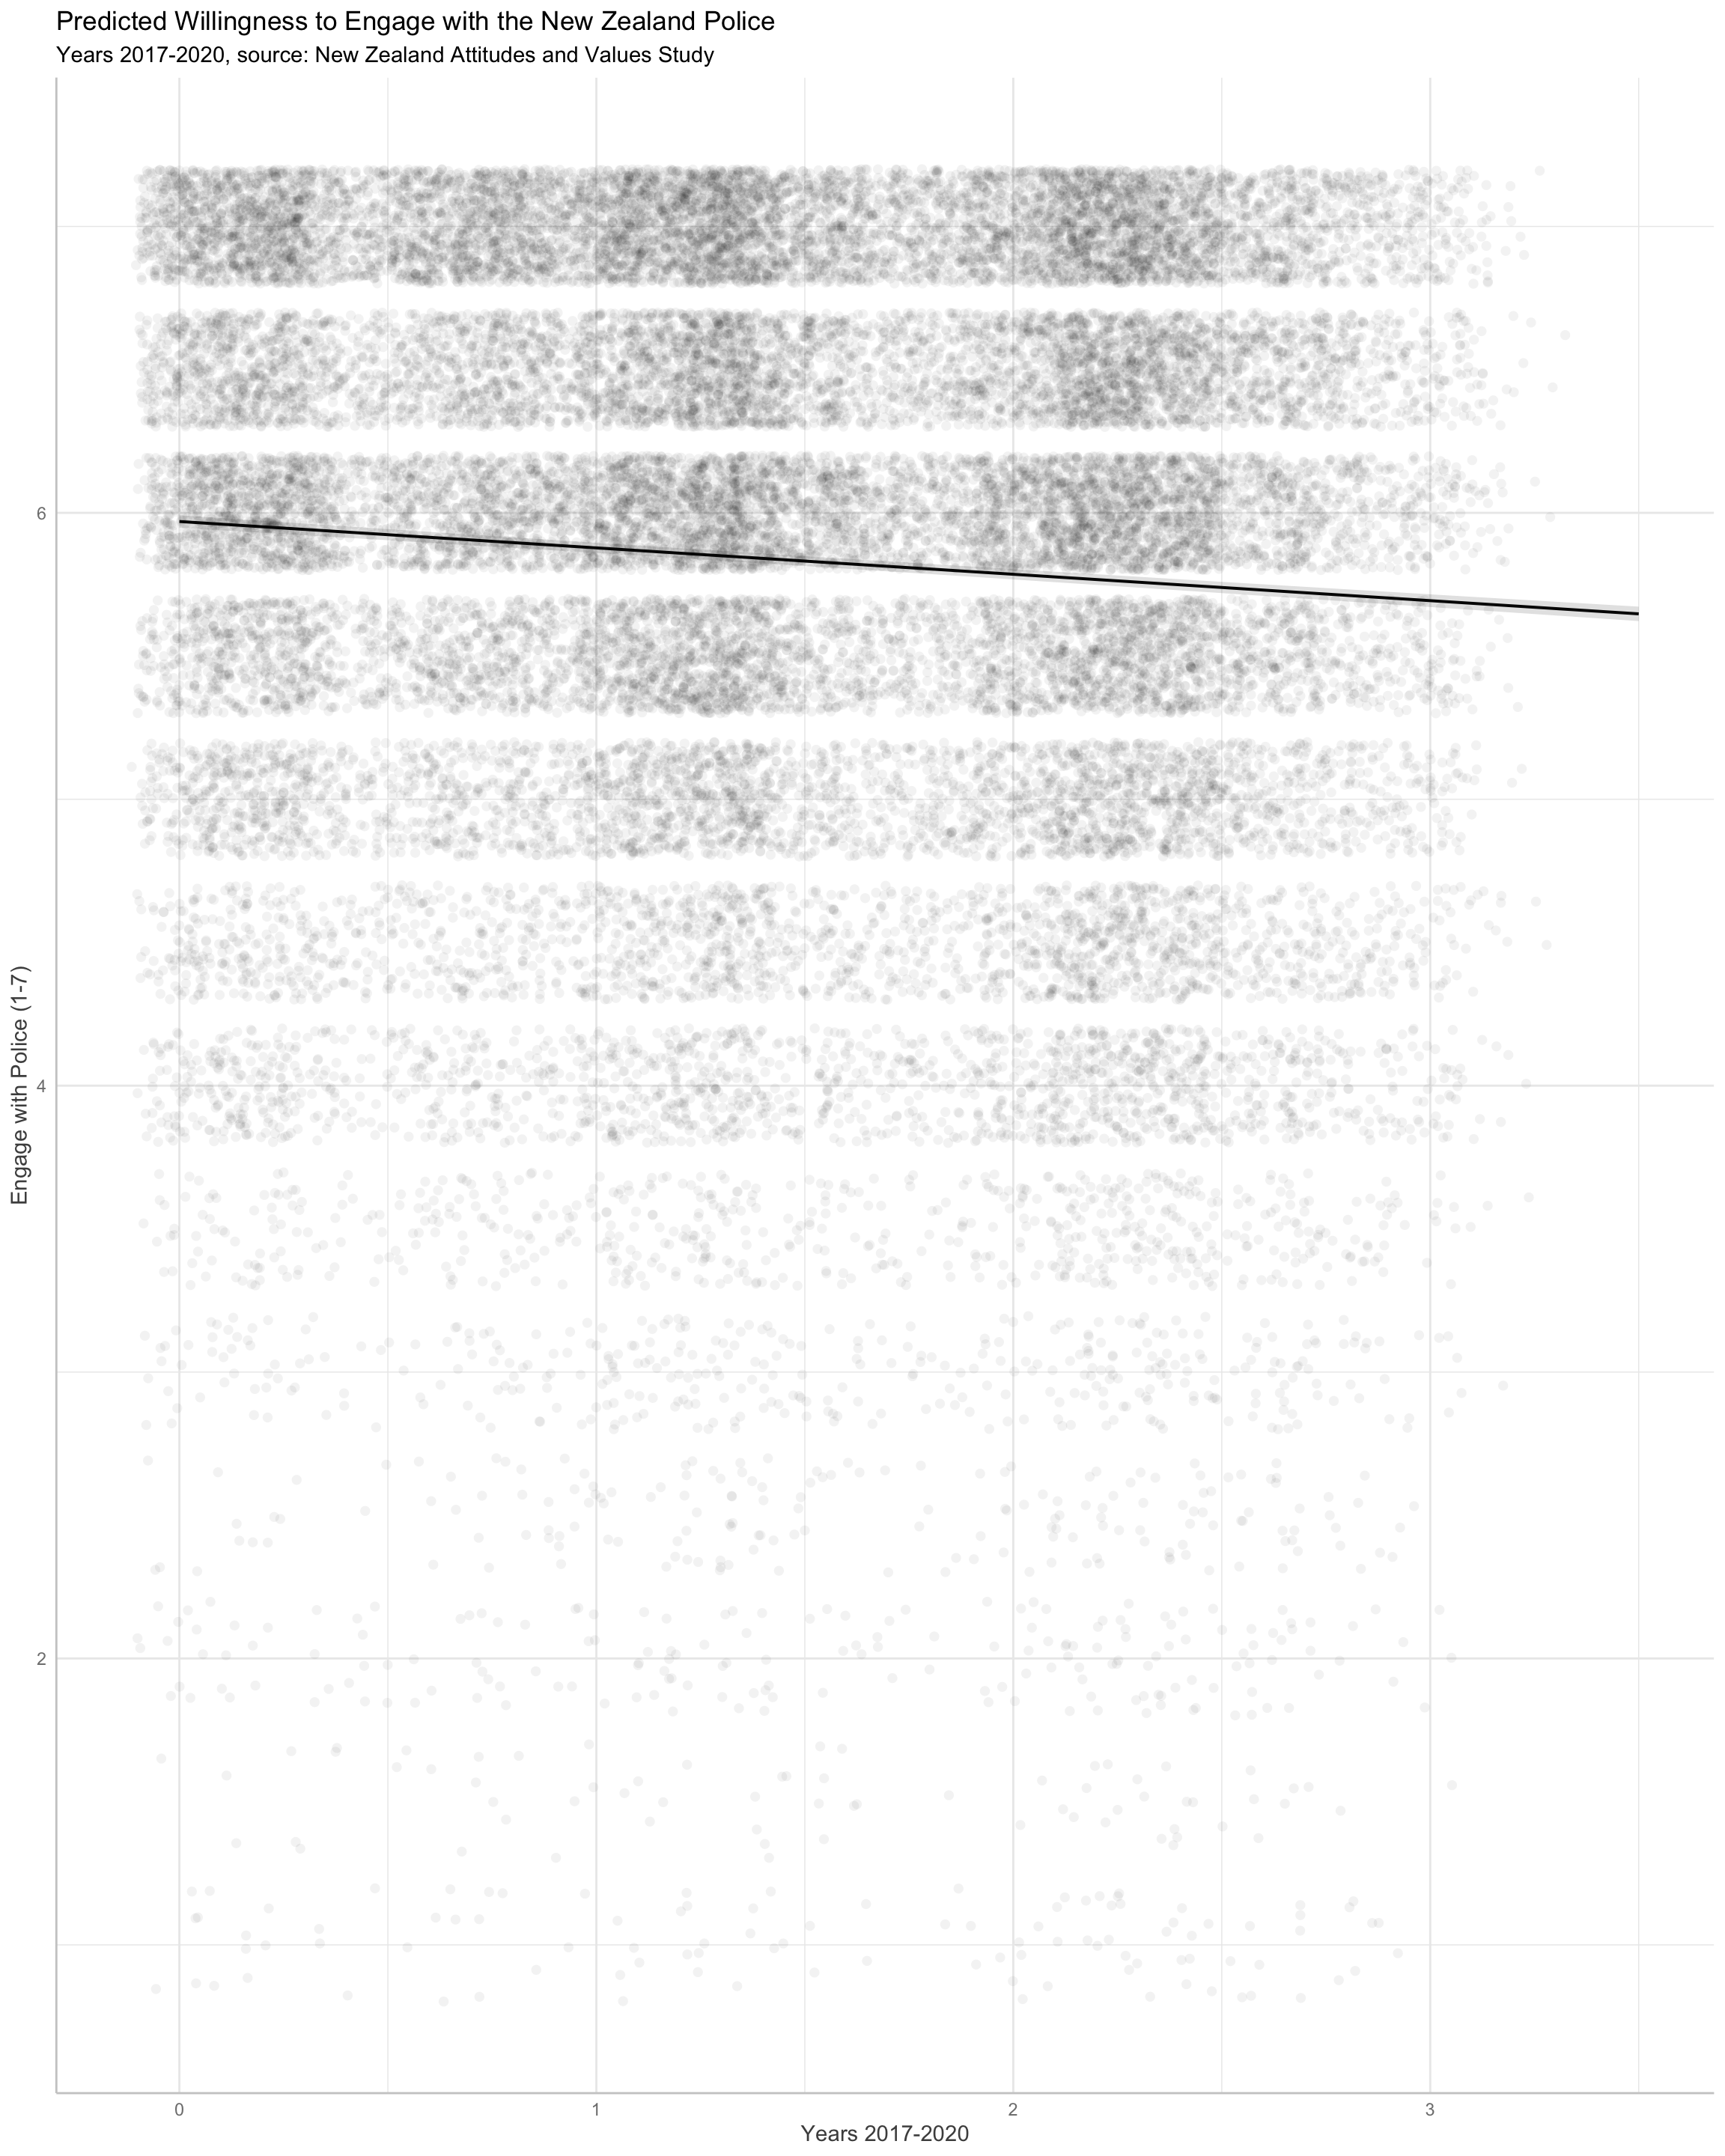
Willingness to engage with the police is generally high but has been dropping since 2017
Second, we model the time trend in willingness to engage with the New Zealand police over time, using a model that also adjusts for the effects of the Covid-19 pandemic.
We find that since 2017, willingness to engage with the New Zealand police is generally high but has been dropping within New Zealanders over time.
Show code
pt2 <-lme4::lmer(Police_Engage ~ year_s + (1|Id), data = pd)
parameters::model_parameters(pt2) %>%
  parameters::print_html(
      caption = "Data from the New Zealand Attitudes and Values Study",
      title = "Willingness to Engage New Zealand Police: years 2017-2020"
  )
| Willingness to Engage New Zealand Police: years 2017-2020 | |||||
|---|---|---|---|---|---|
| Parameter | Coefficient | SE | 95% CI | t(33564) | p |
| Fixed Effects | |||||
| (Intercept) | 5.97 | 0.01 | (5.95, 5.99) | 538.24 | < .001 |
| year s | -0.09 | 4.61e-03 | (-0.10, -0.08) | -19.99 | < .001 |
| Random Effects | |||||
| SD (Intercept: Id) | 0.86 | ||||
| SD (Residual) | 0.68 | ||||
Graphing the trend reveals this steady decrease in willingness to assist the police.
Show code
pl2 <- plot(ggeffects::ggpredict(pt2,
                                 effects = c("year_s")),
            add.data = TRUE,
            dot.alpha = .05)[[1]] +
  xlab("Years 2017-2020") +
  ylab("Engage with Police (1-7)") +
  labs(title = "Predicted Willingness to Engage with the New Zealand Police",
       subtitle = "Years 2017-2020, source: New Zealand Attitudes and Values Study")
pl2
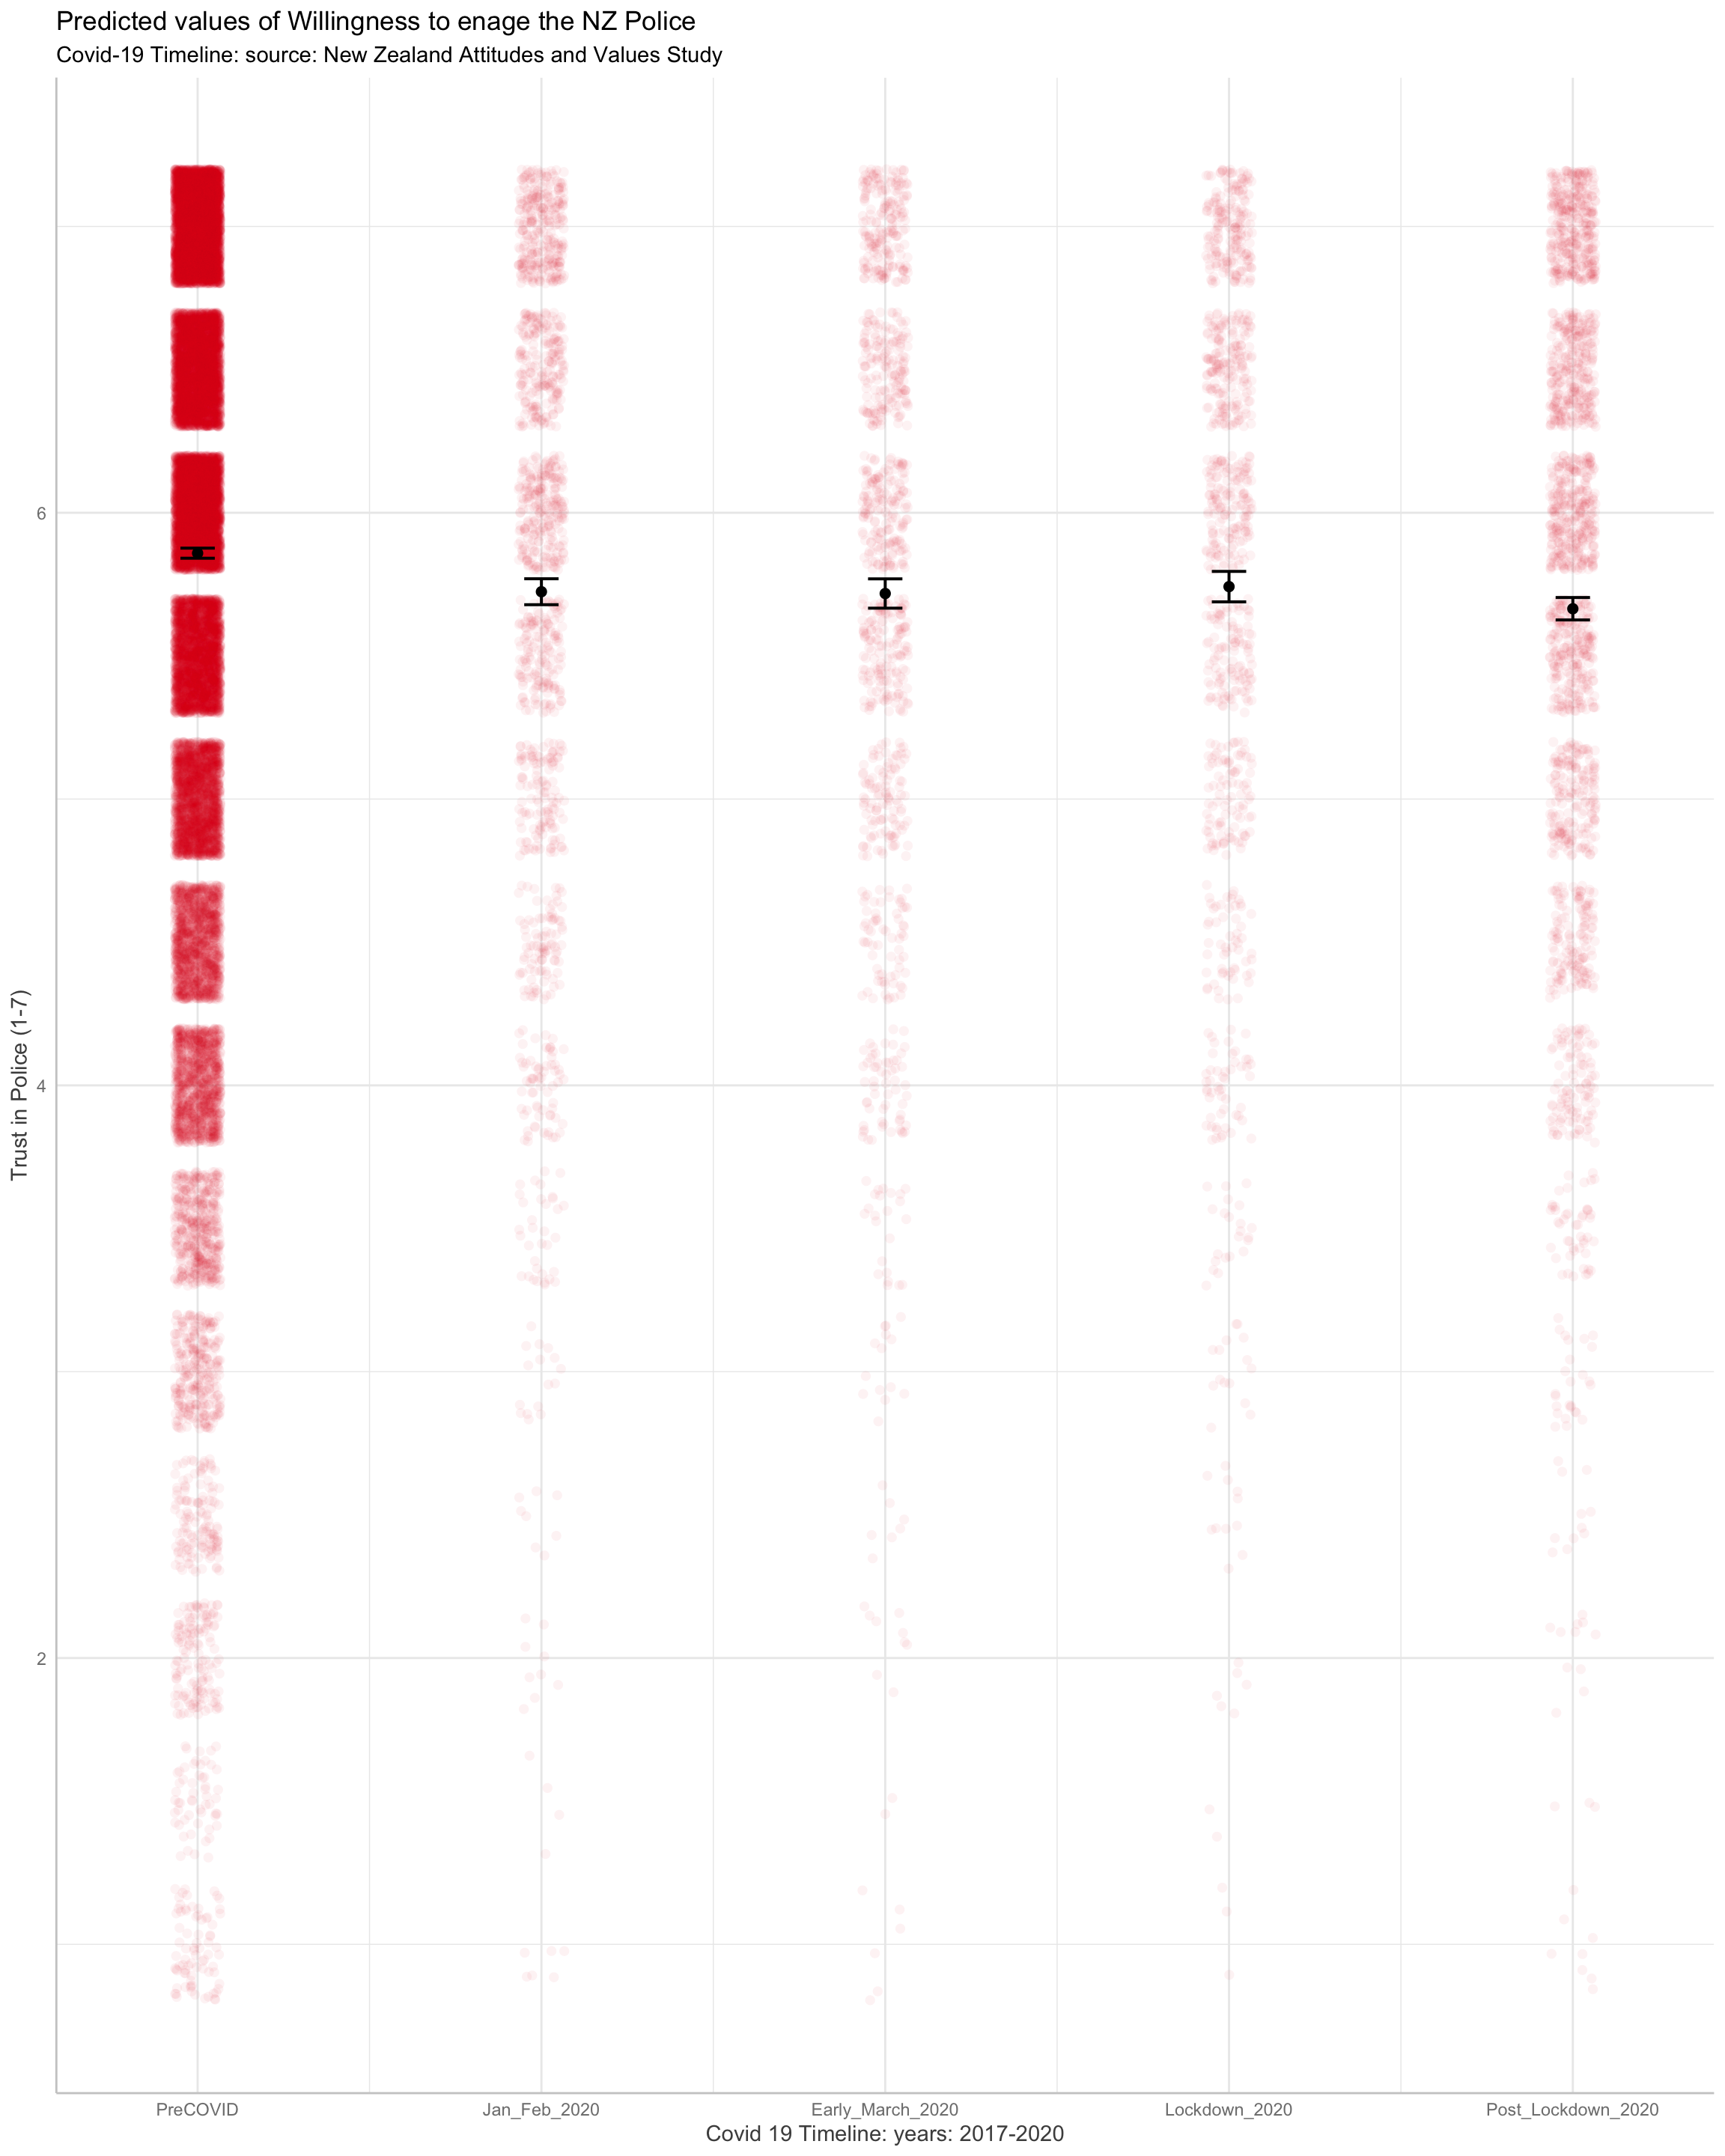
There was no change in willingness to engage the police during New Zealand’s March/April 2020 lockdown
Focusing on Covid specific predictions (while holding the time effect constant), we find no evidence for change in willingness to engage with the police during New Zealand’s stringent Covid-19 pandemic lockdown of late March/April 2020.
Show code
pt2t <-lme4::lmer(Police_Engage ~ Covid_Timeline + (1|Id), data = pd)

pl2_b <- plot(
  ggeffects::ggpredict(pt2t,
                       effects = "Covid_Timeline"),
  add.data = TRUE,
  dot.alpha = .05
)[[1]] +
  xlab("Covid 19 Timeline: years: 2017-2020") +
  ylab("Trust in Police (1-7)") +
  labs(title = "Predicted values of Willingness to enage the NZ Police",
       subtitle = "Covid-19 Timeline: source: New Zealand Attitudes and Values Study")
pl2_b
Trust in New Zealand politicians has dropped since 2017, however there was a strong boost during lockdown.
Third we compare the dynamics of trust in the New Zealand Police with the dynamics of trust in New Zealand politicians, employing a parallel model for trust in politicians. We find that since 2017, trust in the New Zealand Politicians has dropped within New Zealanders.
Show code
pt3 <-
  lme4::lmer(Politicians_Trust ~ year_s + (1 | Id), data = pd)
parameters::model_parameters(pt3) %>%
  parameters::print_html(caption = "Data from the New Zealand Attitudes and Values Study",
                         title = "Trust in Politicians: years 2017-2020")
| Trust in Politicians: years 2017-2020 | |||||
|---|---|---|---|---|---|
| Parameter | Coefficient | SE | 95% CI | t(33648) | p |
| Fixed Effects | |||||
| (Intercept) | 3.93 | 0.01 | (3.90, 3.96) | 269.32 | < .001 |
| year s | -0.04 | 6.18e-03 | (-0.05, -0.03) | -6.72 | < .001 |
| Random Effects | |||||
| SD (Intercept: Id) | 1.11 | ||||
| SD (Residual) | 0.91 | ||||
Graphing the trend for trust in New Zealand politicians:
Show code
pl3 <- plot(
  ggeffects::ggpredict(pt3,
                       effects = c("year_s")),
  add.data = TRUE,
  jitter = .45,
  dot.alpha = .05
)[[1]] +
  xlab("Years 2017-2020") +
  ylab("Trust in Politicians (1-7)") +
  labs(title = "Predicted Trust in New Zealand Politicians",
       subtitle = "Years 2017-2020, source: New Zealand Attitudes and Values Study")

pl3
There was a large boost in trust of politicians during New Zealand’s March/April 2020 lockdown
Focusing on Covid specific predictions (while holding the time effect constant), we find evidence for a substantial boost to trust politicians during New Zealand’s stringent Covid-19 pandemic lockdown of late March/April 2020. Notably, this boost appears to have reverted to pre-pandemic levels.
Show code
pt3t <-
  lme4::lmer(Politicians_Trust ~ Covid_Timeline + (1 | Id), data = pd)
pl3_b <- plot(
  ggeffects::ggpredict(pt3t,
                       effects = c("Covid_Timeline")),
  add.data = TRUE,
  dot.alpha = .05
)[[1]] +
  xlab("Covid 19 Timeline: years: 2017-2020") +
  ylab("Trust in Police (1-7)") +
  labs(title = "Predicted values of trust in New Zealand Politicians",
       subtitle = "Covid-19 Timeline: source: New Zealand Attitudes and Values Study")
pl3_b
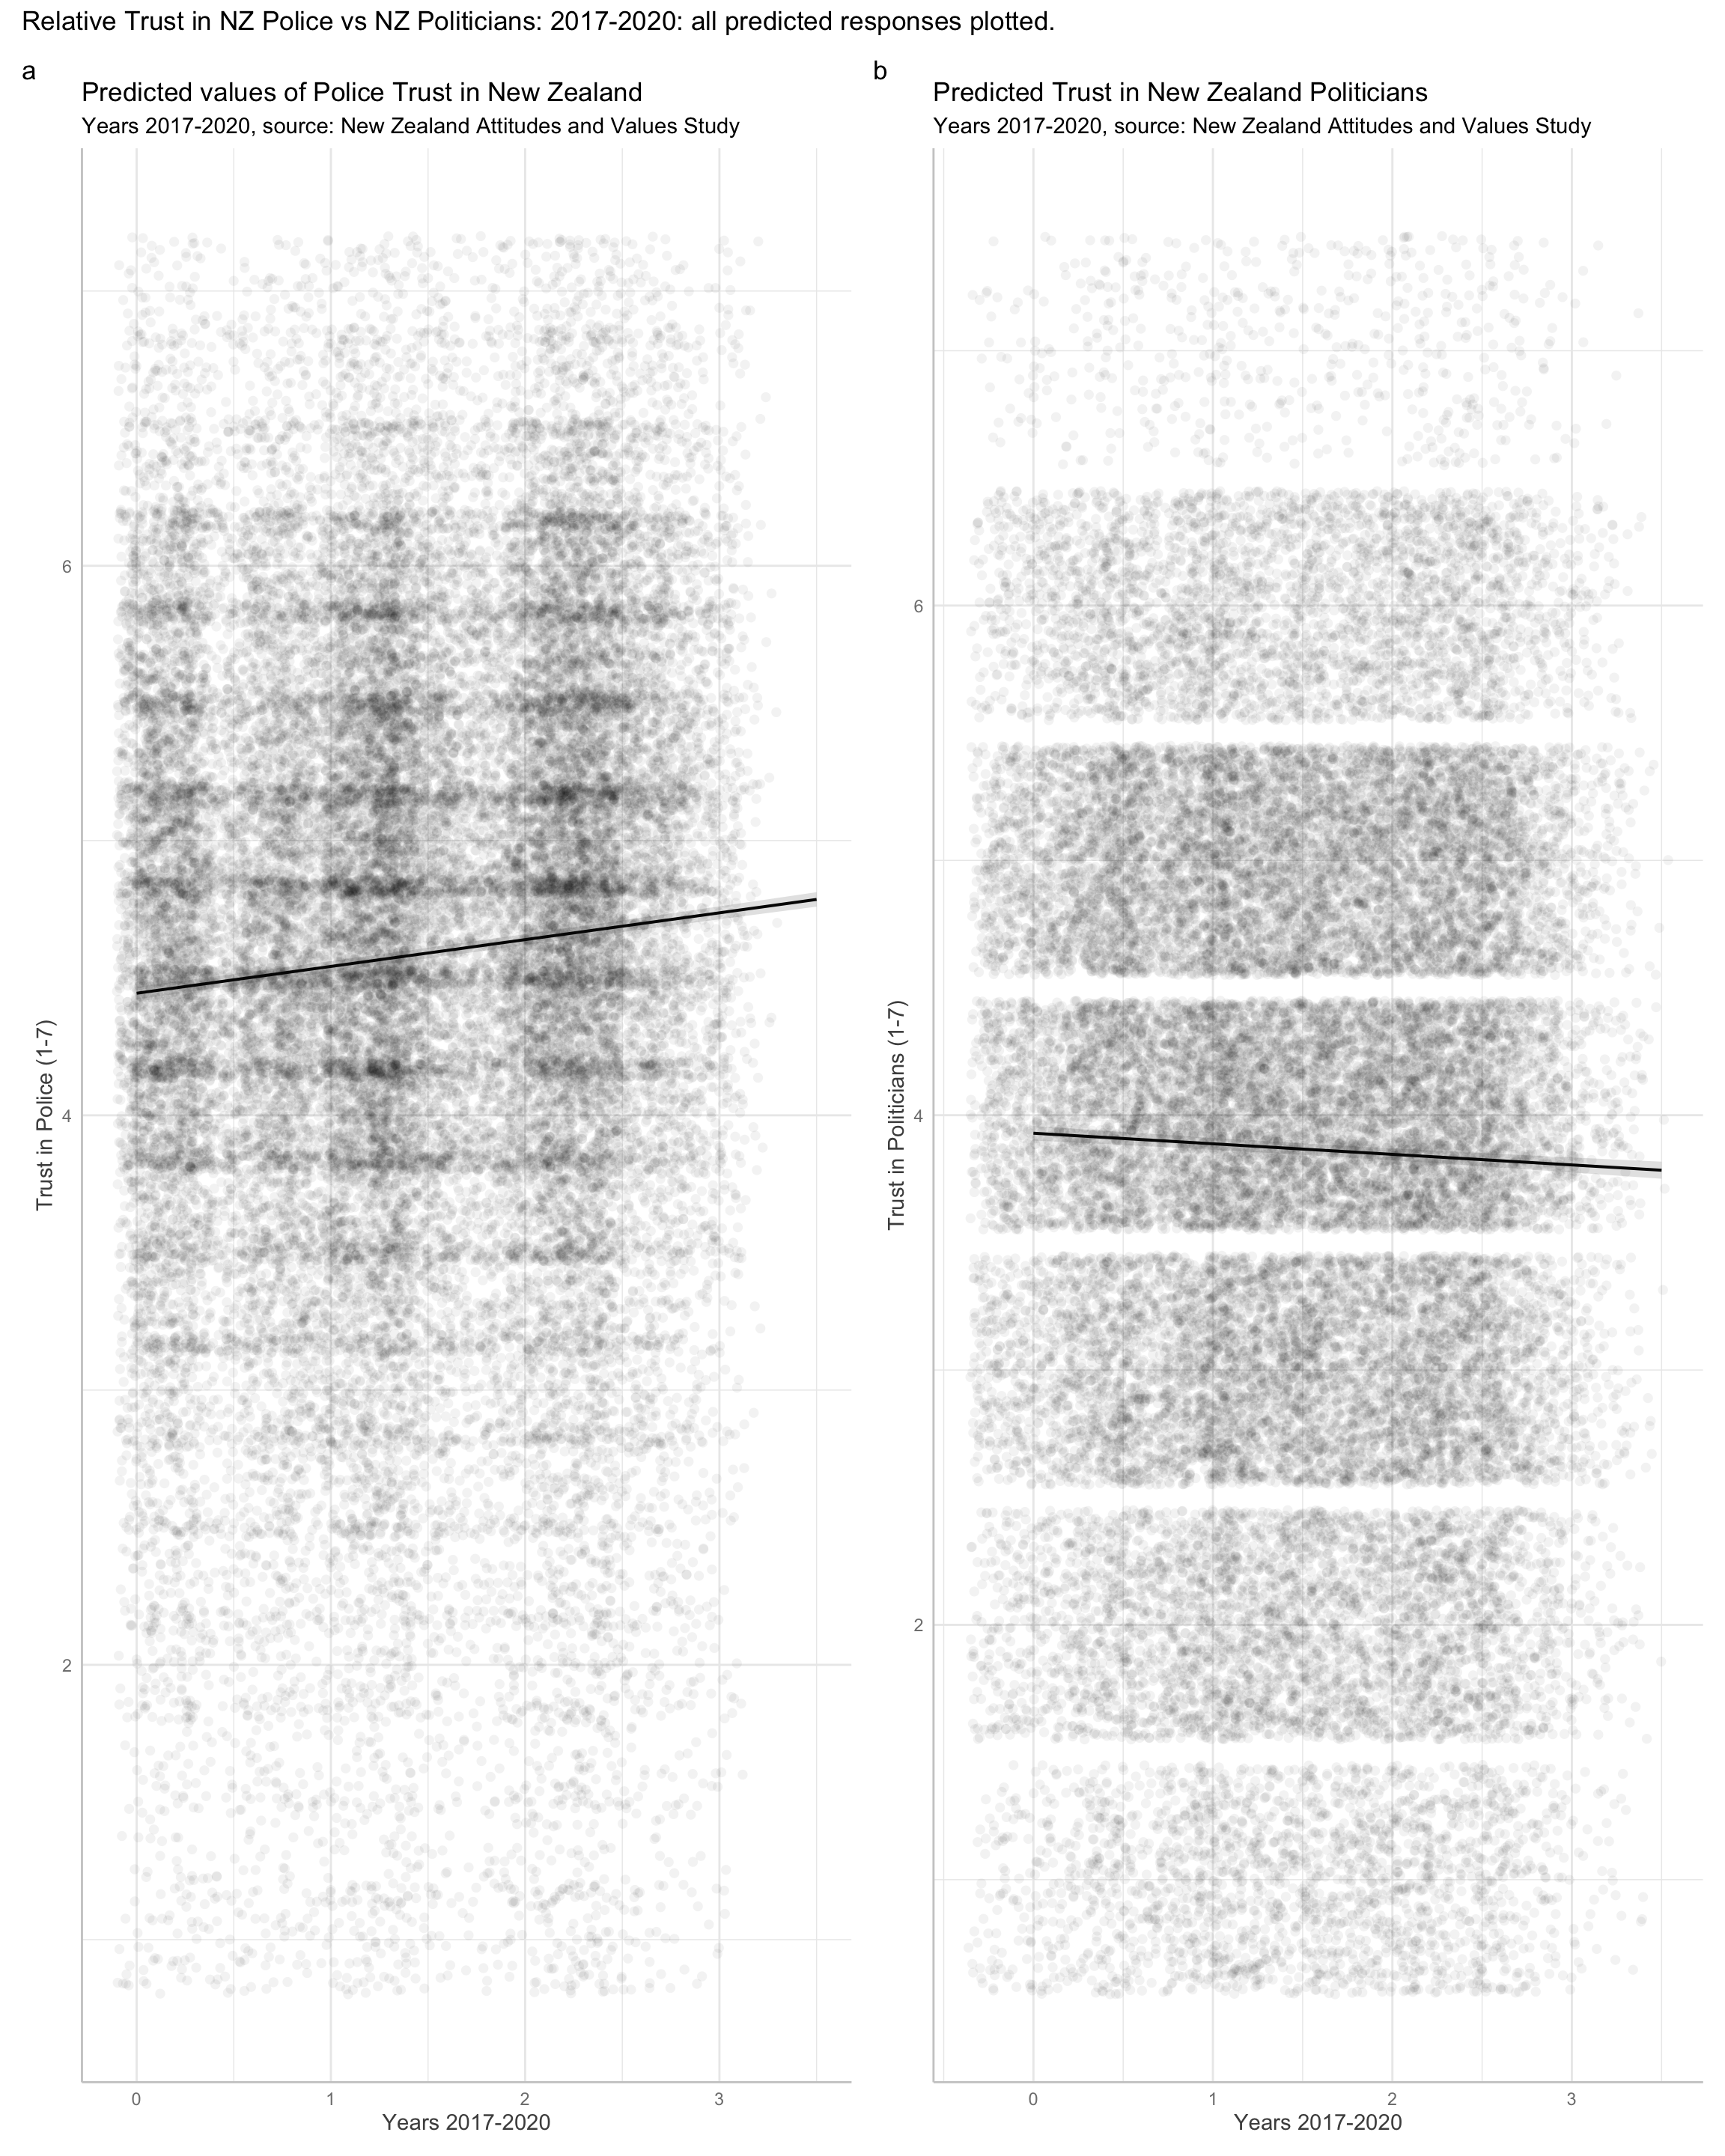
Key message: comparison of trust in New Zealand Police and trust in New Zealand politicians shows relatively higher and growing confidence in the police compared with relatively lower and declining confidence in politicians.
To better understand differences in trust of the New Zealand Police (Fig4.a) and trust in New Zealand Politicians, we can graph both trends side-by-side. Doing so reveals that rising trust in the police is not the result of a generic increase in institutional trust – quite the opposite, institutional trust in the government has been declining – but rather a unique phenomenon.
Show code
library(patchwork)

pl1 + pl3 +
  plot_annotation(title = "Relative Trust in NZ Police vs NZ Politicians: 2017-2020: all predicted responses plotted.",
                  tag_levels = "a")
The evidence we present here for strong and rising trust in the New Zealand Police comes from a national panel sample that repeatedly measures the same individuals in successive years. The NZAVS sample is randomly selected from New Zealand electoral role – a privilege unique to New Zealand’s research community. NZAVS time series data possess an integrity that brings confidence to these preliminary findings. However, the causal processes underpinning strong and increasing trust in the New Zealand’s police remain unclear. Clarifying why the New Zealand Police is highly trusted holds importance for New Zealanders who wish to sustain such confidence; such understanding may also be important to countries who experience lower confidence in their police and seek to improve confidence. The decline in willingness to engage with the poslice also merits future investigation. Speculating, it is possible that this decline is part of a wider loss of confidence in political institutions, however, the causes of the phenomena observed here remain unclear, and there may be no unitary explanation. Critical questions of causation remain matters for future investigations.
Appendix
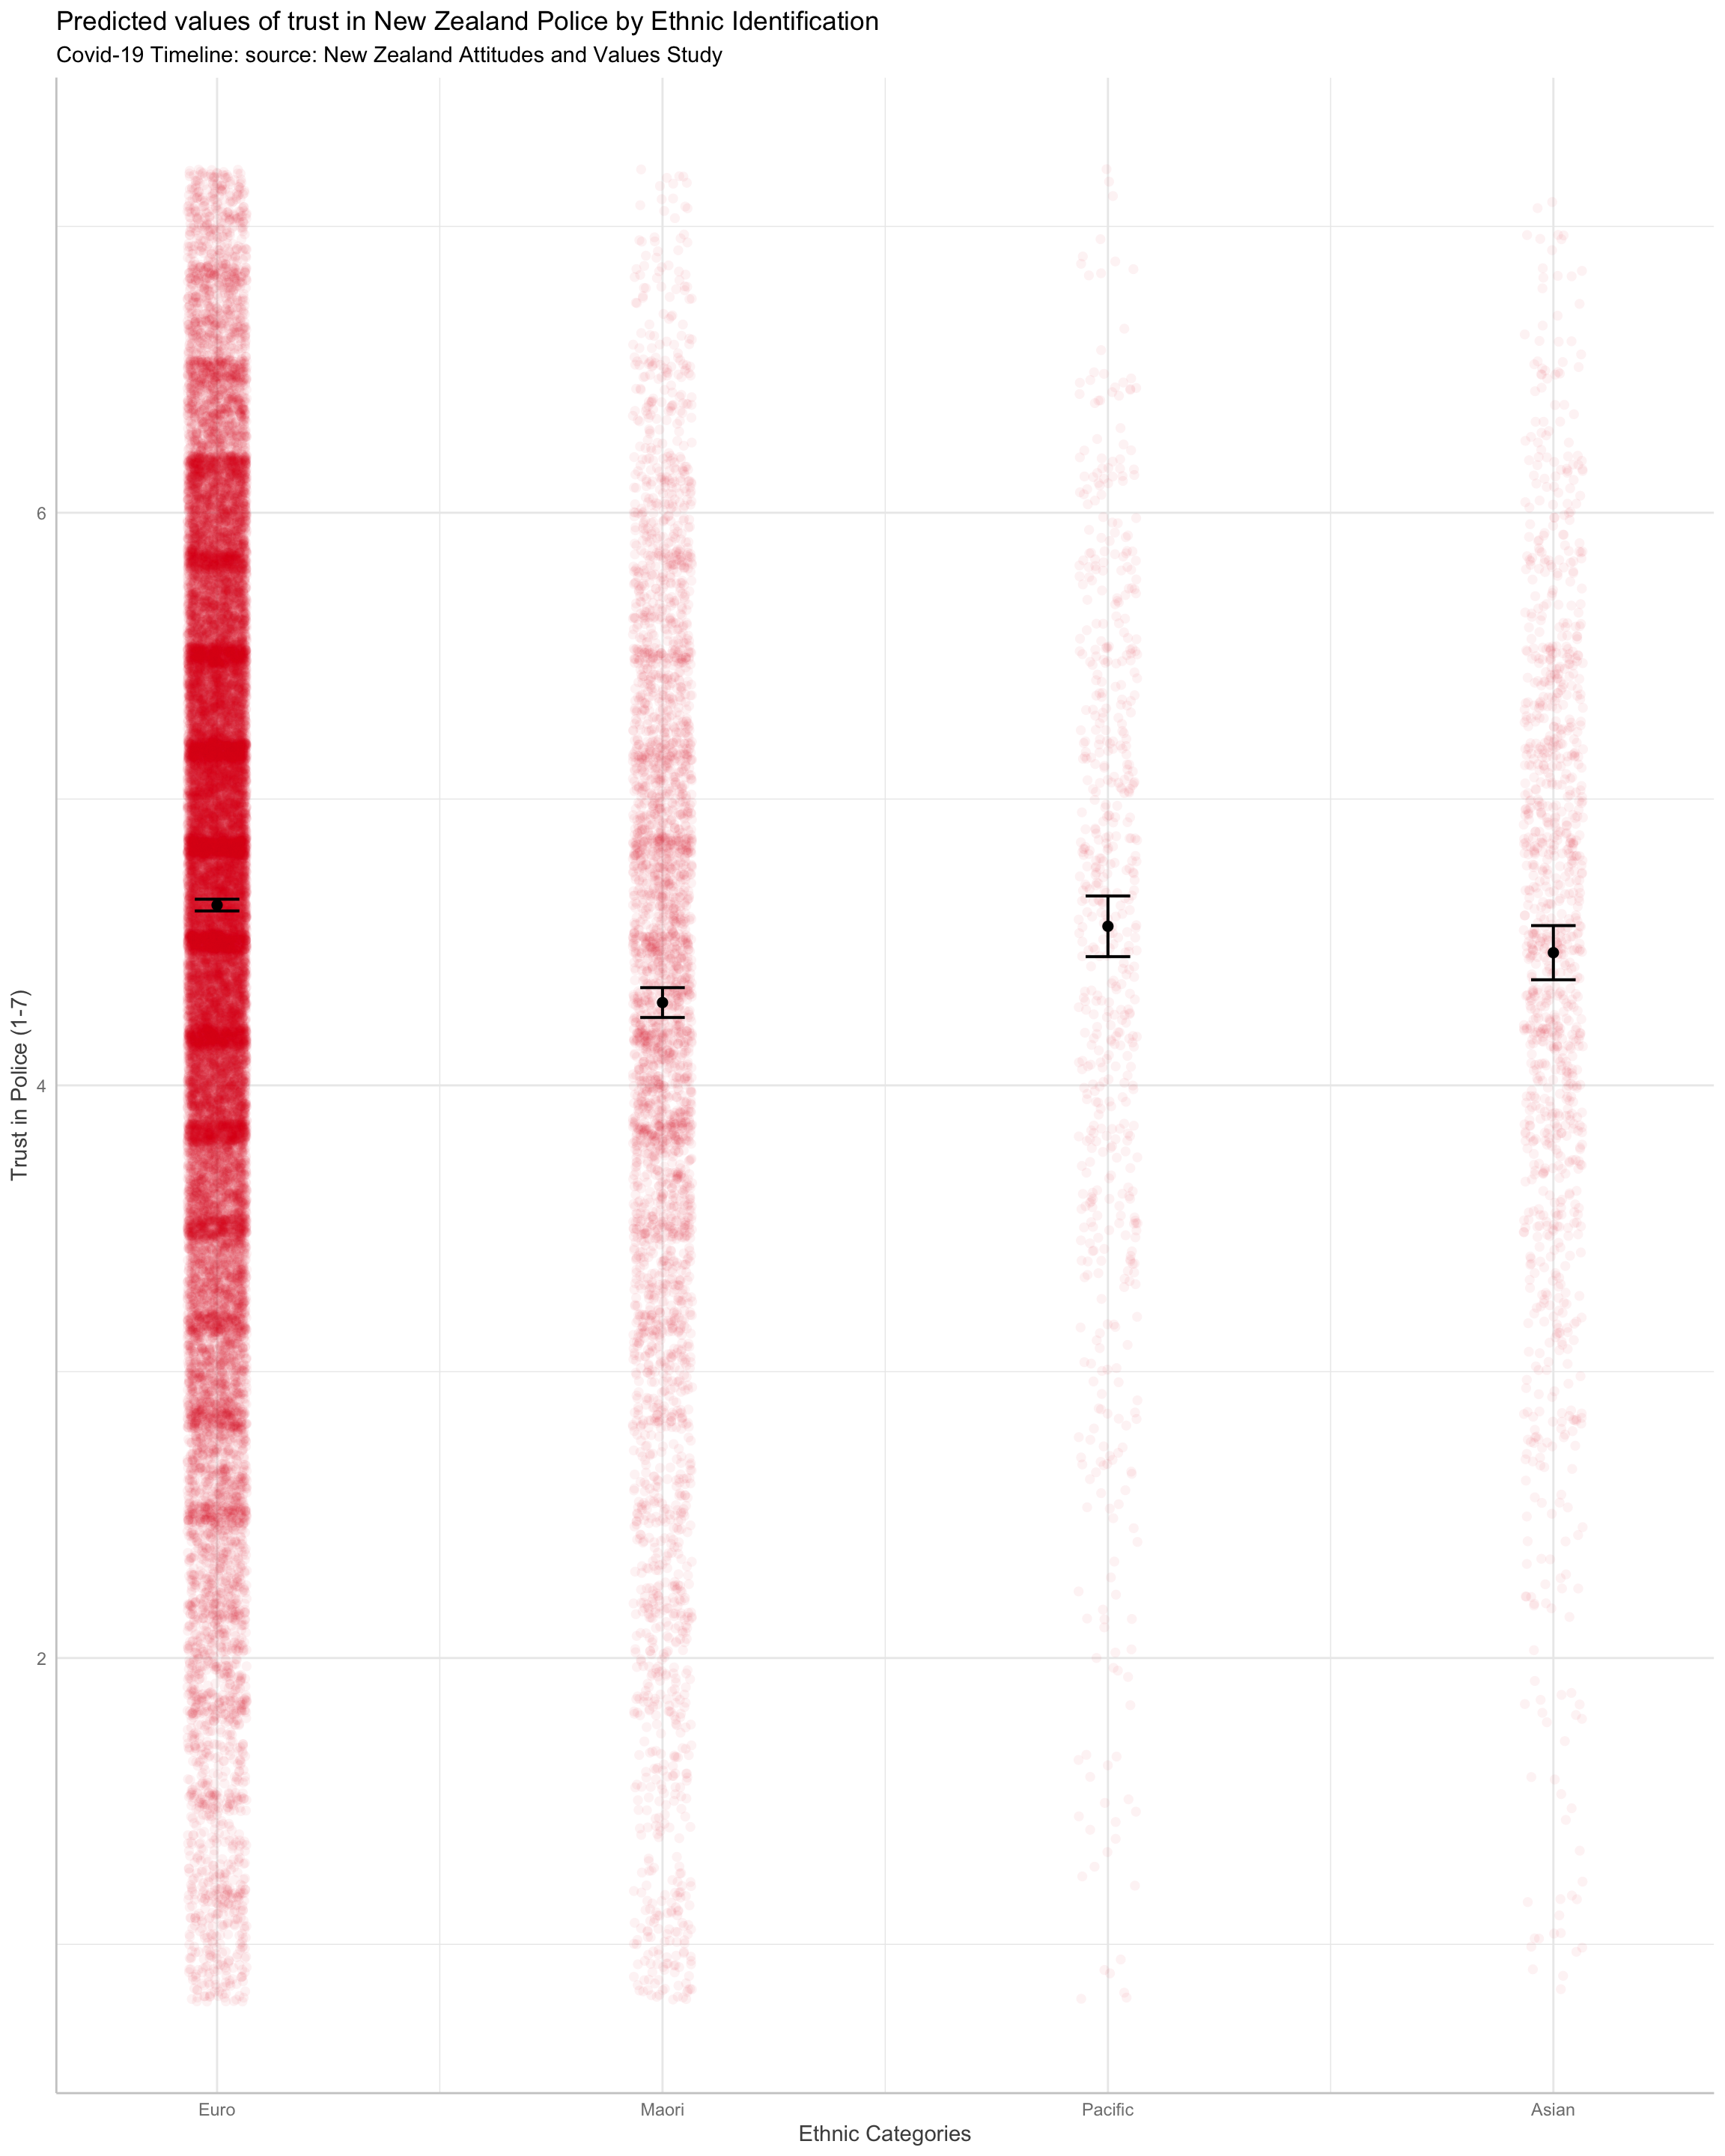
Trust in police predicted by ethnic identification
Maori are much less trusting of the police, on average, than NZ Europeans and other ethnic groups.
Show code
pt4 <-
  lme4::lmer(Police_Trust ~ Ethnic_Categories +  year_s  + (1 | Id), data = pd)

parameters::model_parameters(pt4)
# Fixed Effects

Parameter                   | Coefficient |       SE |         95% CI | t(33798) |      p
-----------------------------------------------------------------------------------------
(Intercept)                 |        4.48 |     0.01 | [ 4.46,  4.51] |   367.63 | < .001
Ethnic Categories [Maori]   |       -0.34 |     0.03 | [-0.40, -0.29] |   -12.25 | < .001
Ethnic Categories [Pacific] |       -0.07 |     0.05 | [-0.18,  0.03] |    -1.36 | 0.173
Ethnic Categories [Asian]   |       -0.17 |     0.05 | [-0.26, -0.07] |    -3.39 | < .001
year s                      |        0.10 | 4.49e-03 | [ 0.09,  0.11] |    22.54 | < .001

# Random Effects

Parameter          | Coefficient
--------------------------------
SD (Intercept: Id) |        0.97
SD (Residual)      |        0.66
Show code
pt4_b <- plot(
  ggeffects::ggpredict(pt4,
                       effects = c("year_s","Ethnic_Categories")),
add.data = TRUE,
 dot.alpha = .05
)[[1]] +
  xlab("Ethnic Categories") +
  ylab("Trust in Police (1-7)") +
  labs(title = "Predicted values of trust in New Zealand Police by Ethnic Identification",
       subtitle = "Covid-19 Timeline: source: New Zealand Attitudes and Values Study")
pt4_b
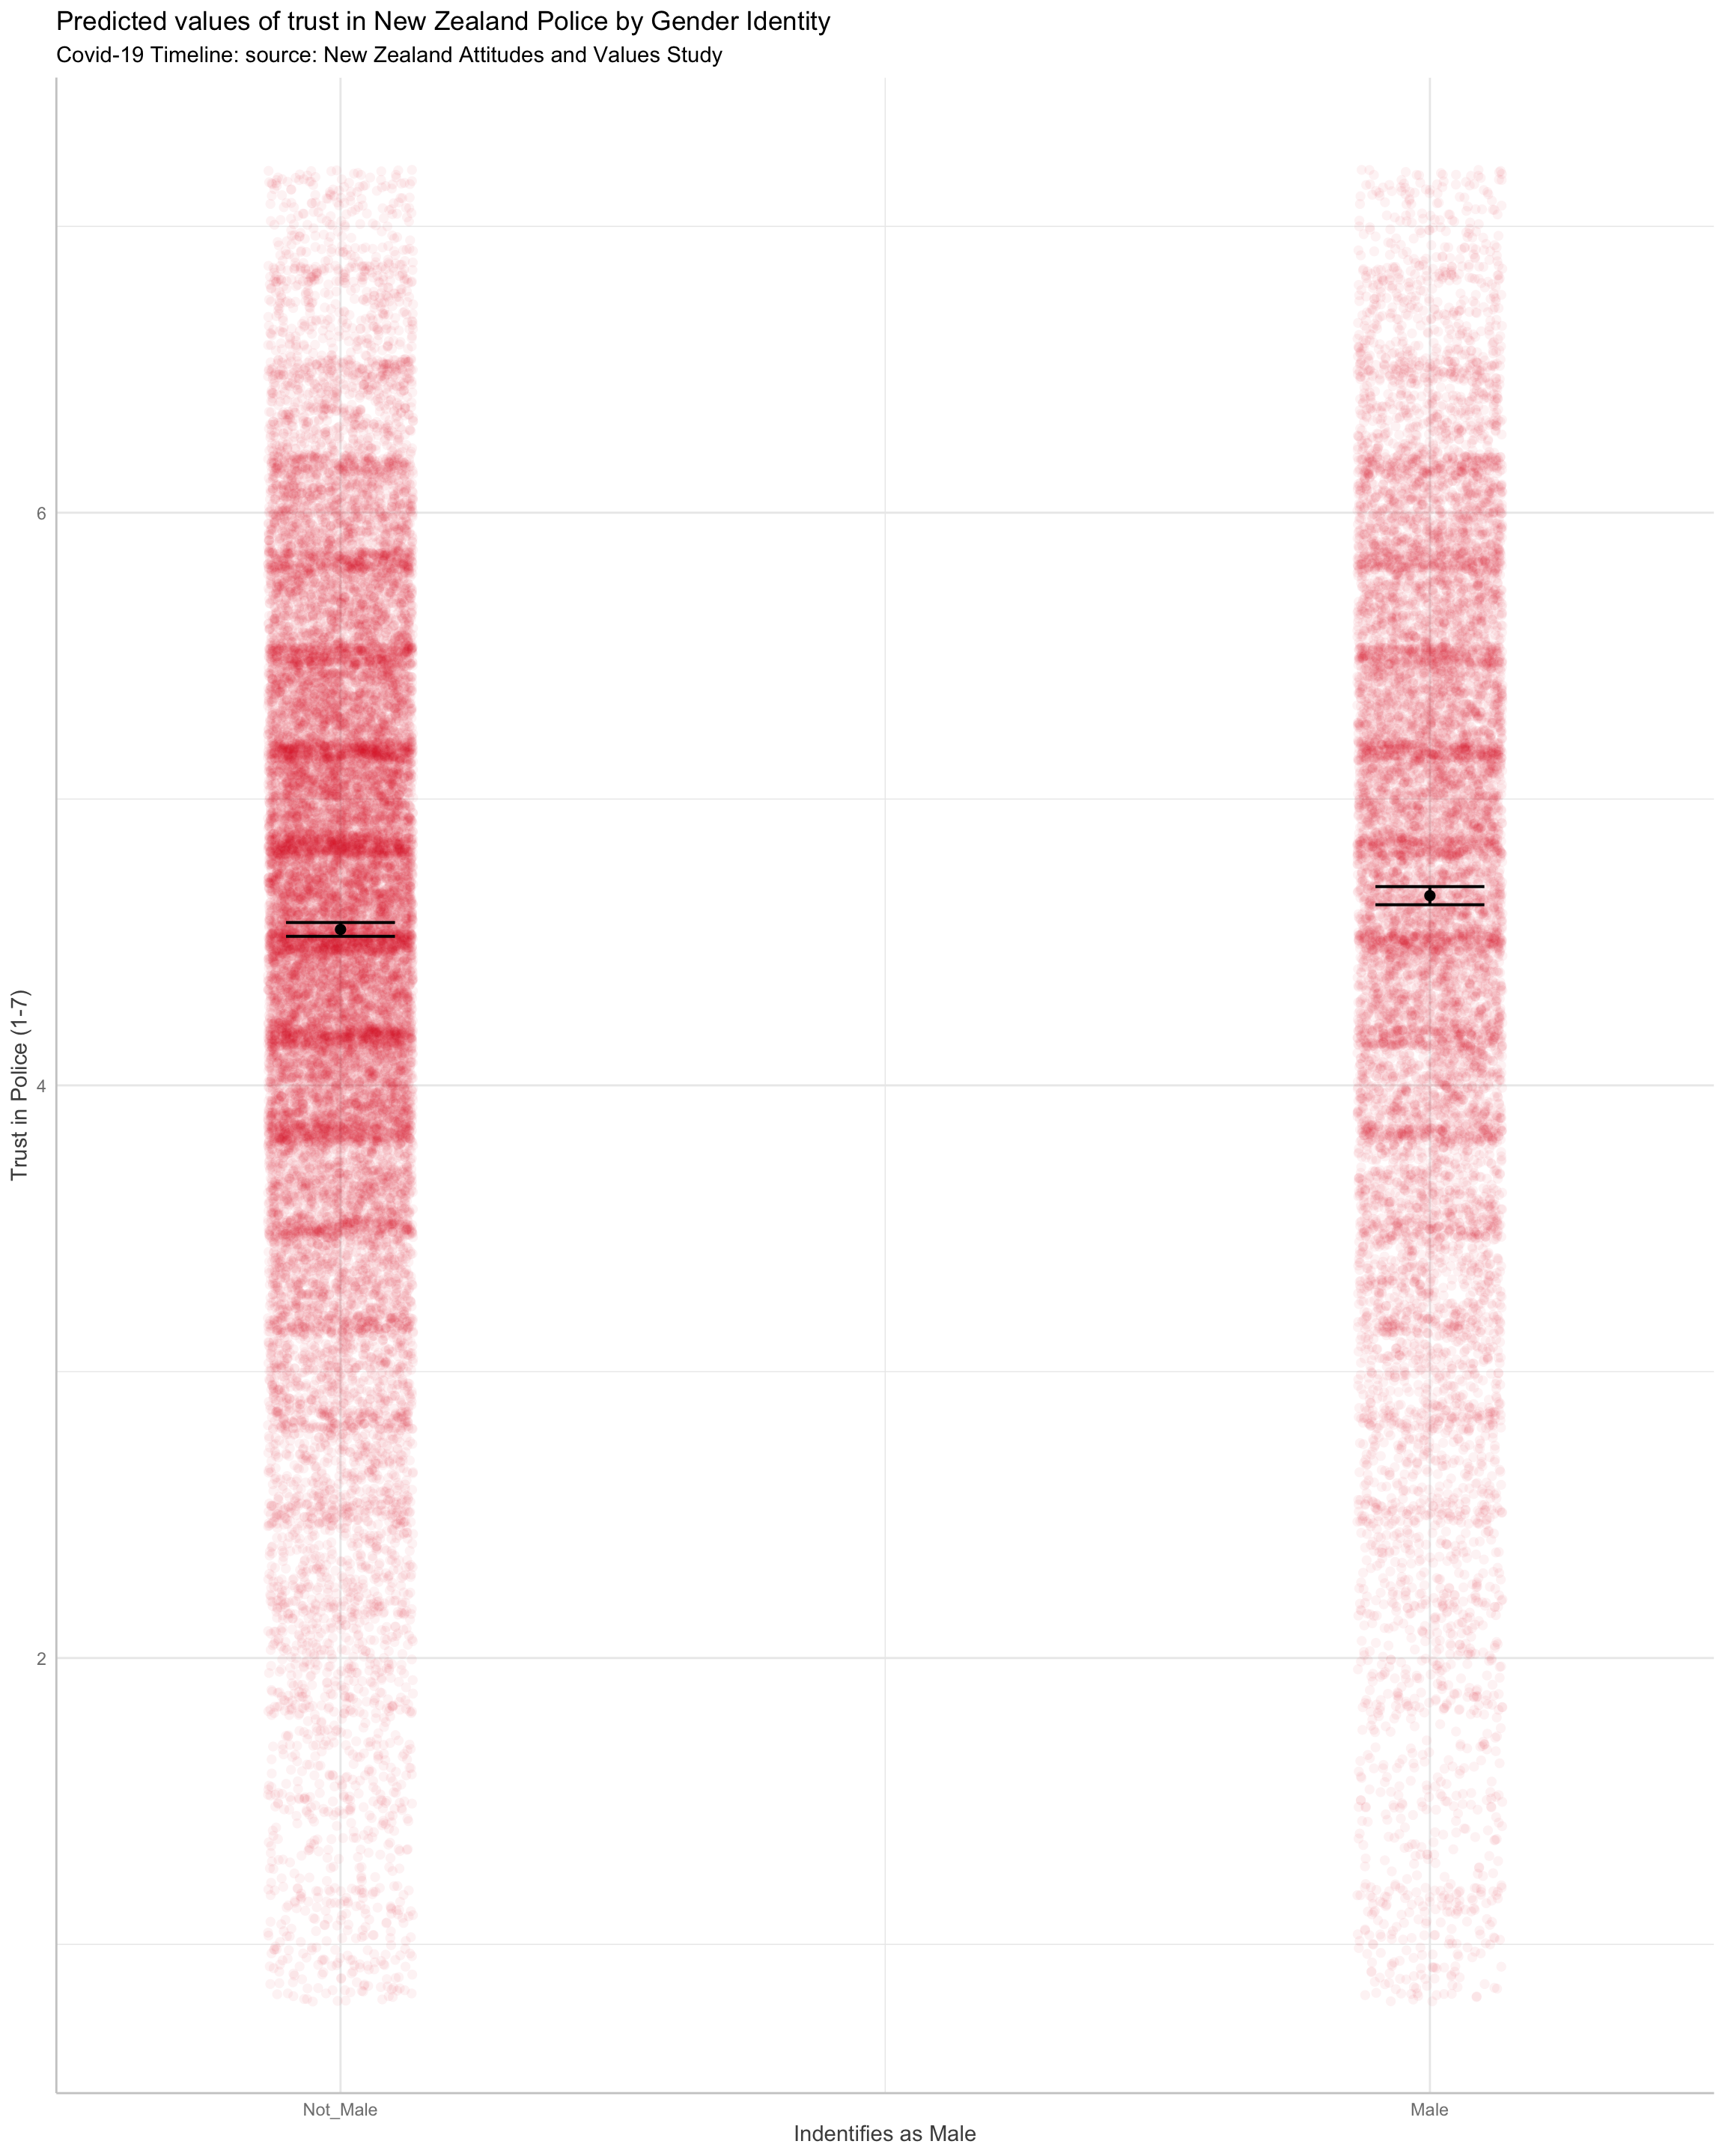
Trust in police predicted by gender identity
Those who identify as male are more trusting of the police.
Show code
pt5 <-
  lme4::lmer(Police_Trust ~ Male + year_s + (1 | Id), data = pd)


pt5_b <- plot(
  ggeffects::ggpredict(pt5,
                       effects = c("Male")),
  add.data = TRUE,
  dot.alpha = .05
)[[1]] +
  xlab("Indentifies as Male") +
  ylab("Trust in Police (1-7)") +
  labs(title = "Predicted values of trust in New Zealand Police by Gender Identity",
       subtitle = "Covid-19 Timeline: source: New Zealand Attitudes and Values Study")
pt5_b
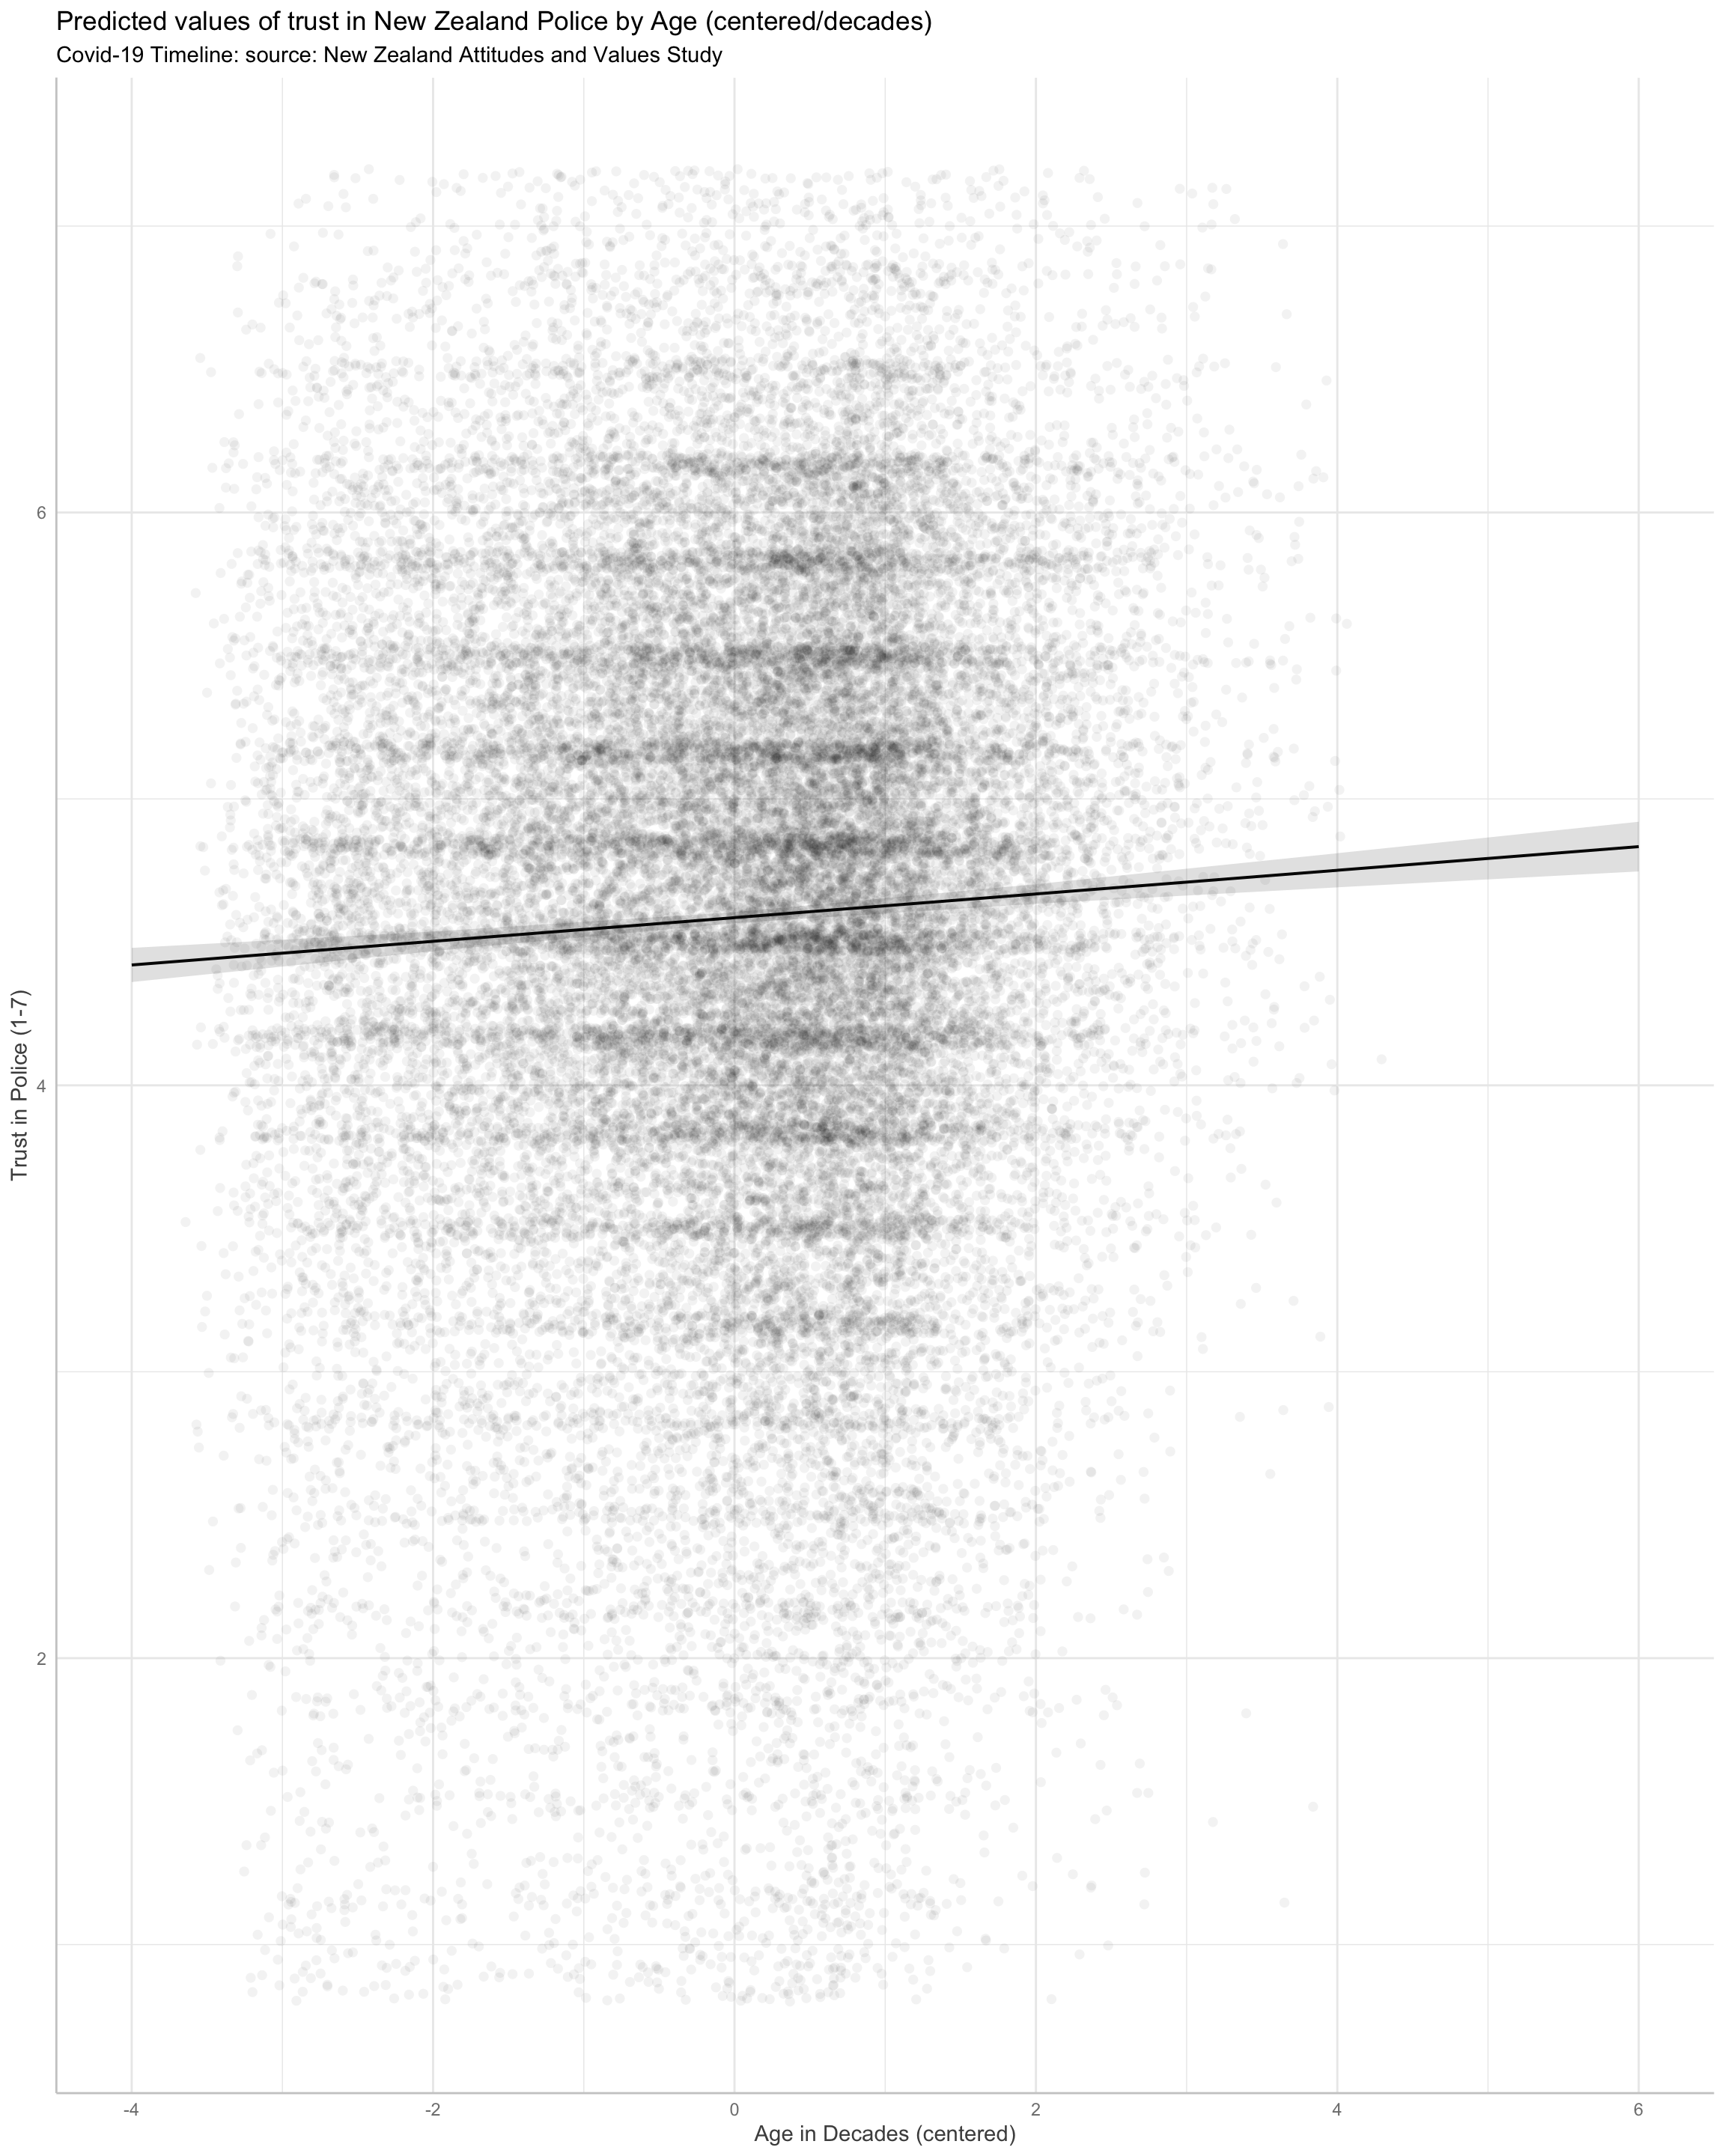
Trust in police predicted by age
Older people are more trusting of the Police.
Show code
pt6 <-
  lme4::lmer(Police_Trust ~ AgeDecadeC + year_s  + (1 | Id), data = pd)


pt6_b <- plot(
  ggeffects::ggpredict(pt6,
                       effects = c("Age")),
  add.data = TRUE,
  dot.alpha = .05
)[[1]] +
  xlab("Age in Decades (centered)") +
  ylab("Trust in Police (1-7)") +
  labs(title = "Predicted values of trust in New Zealand Police by Age (centered/decades)",
       subtitle = "Covid-19 Timeline: source: New Zealand Attitudes and Values Study")
pt6_b
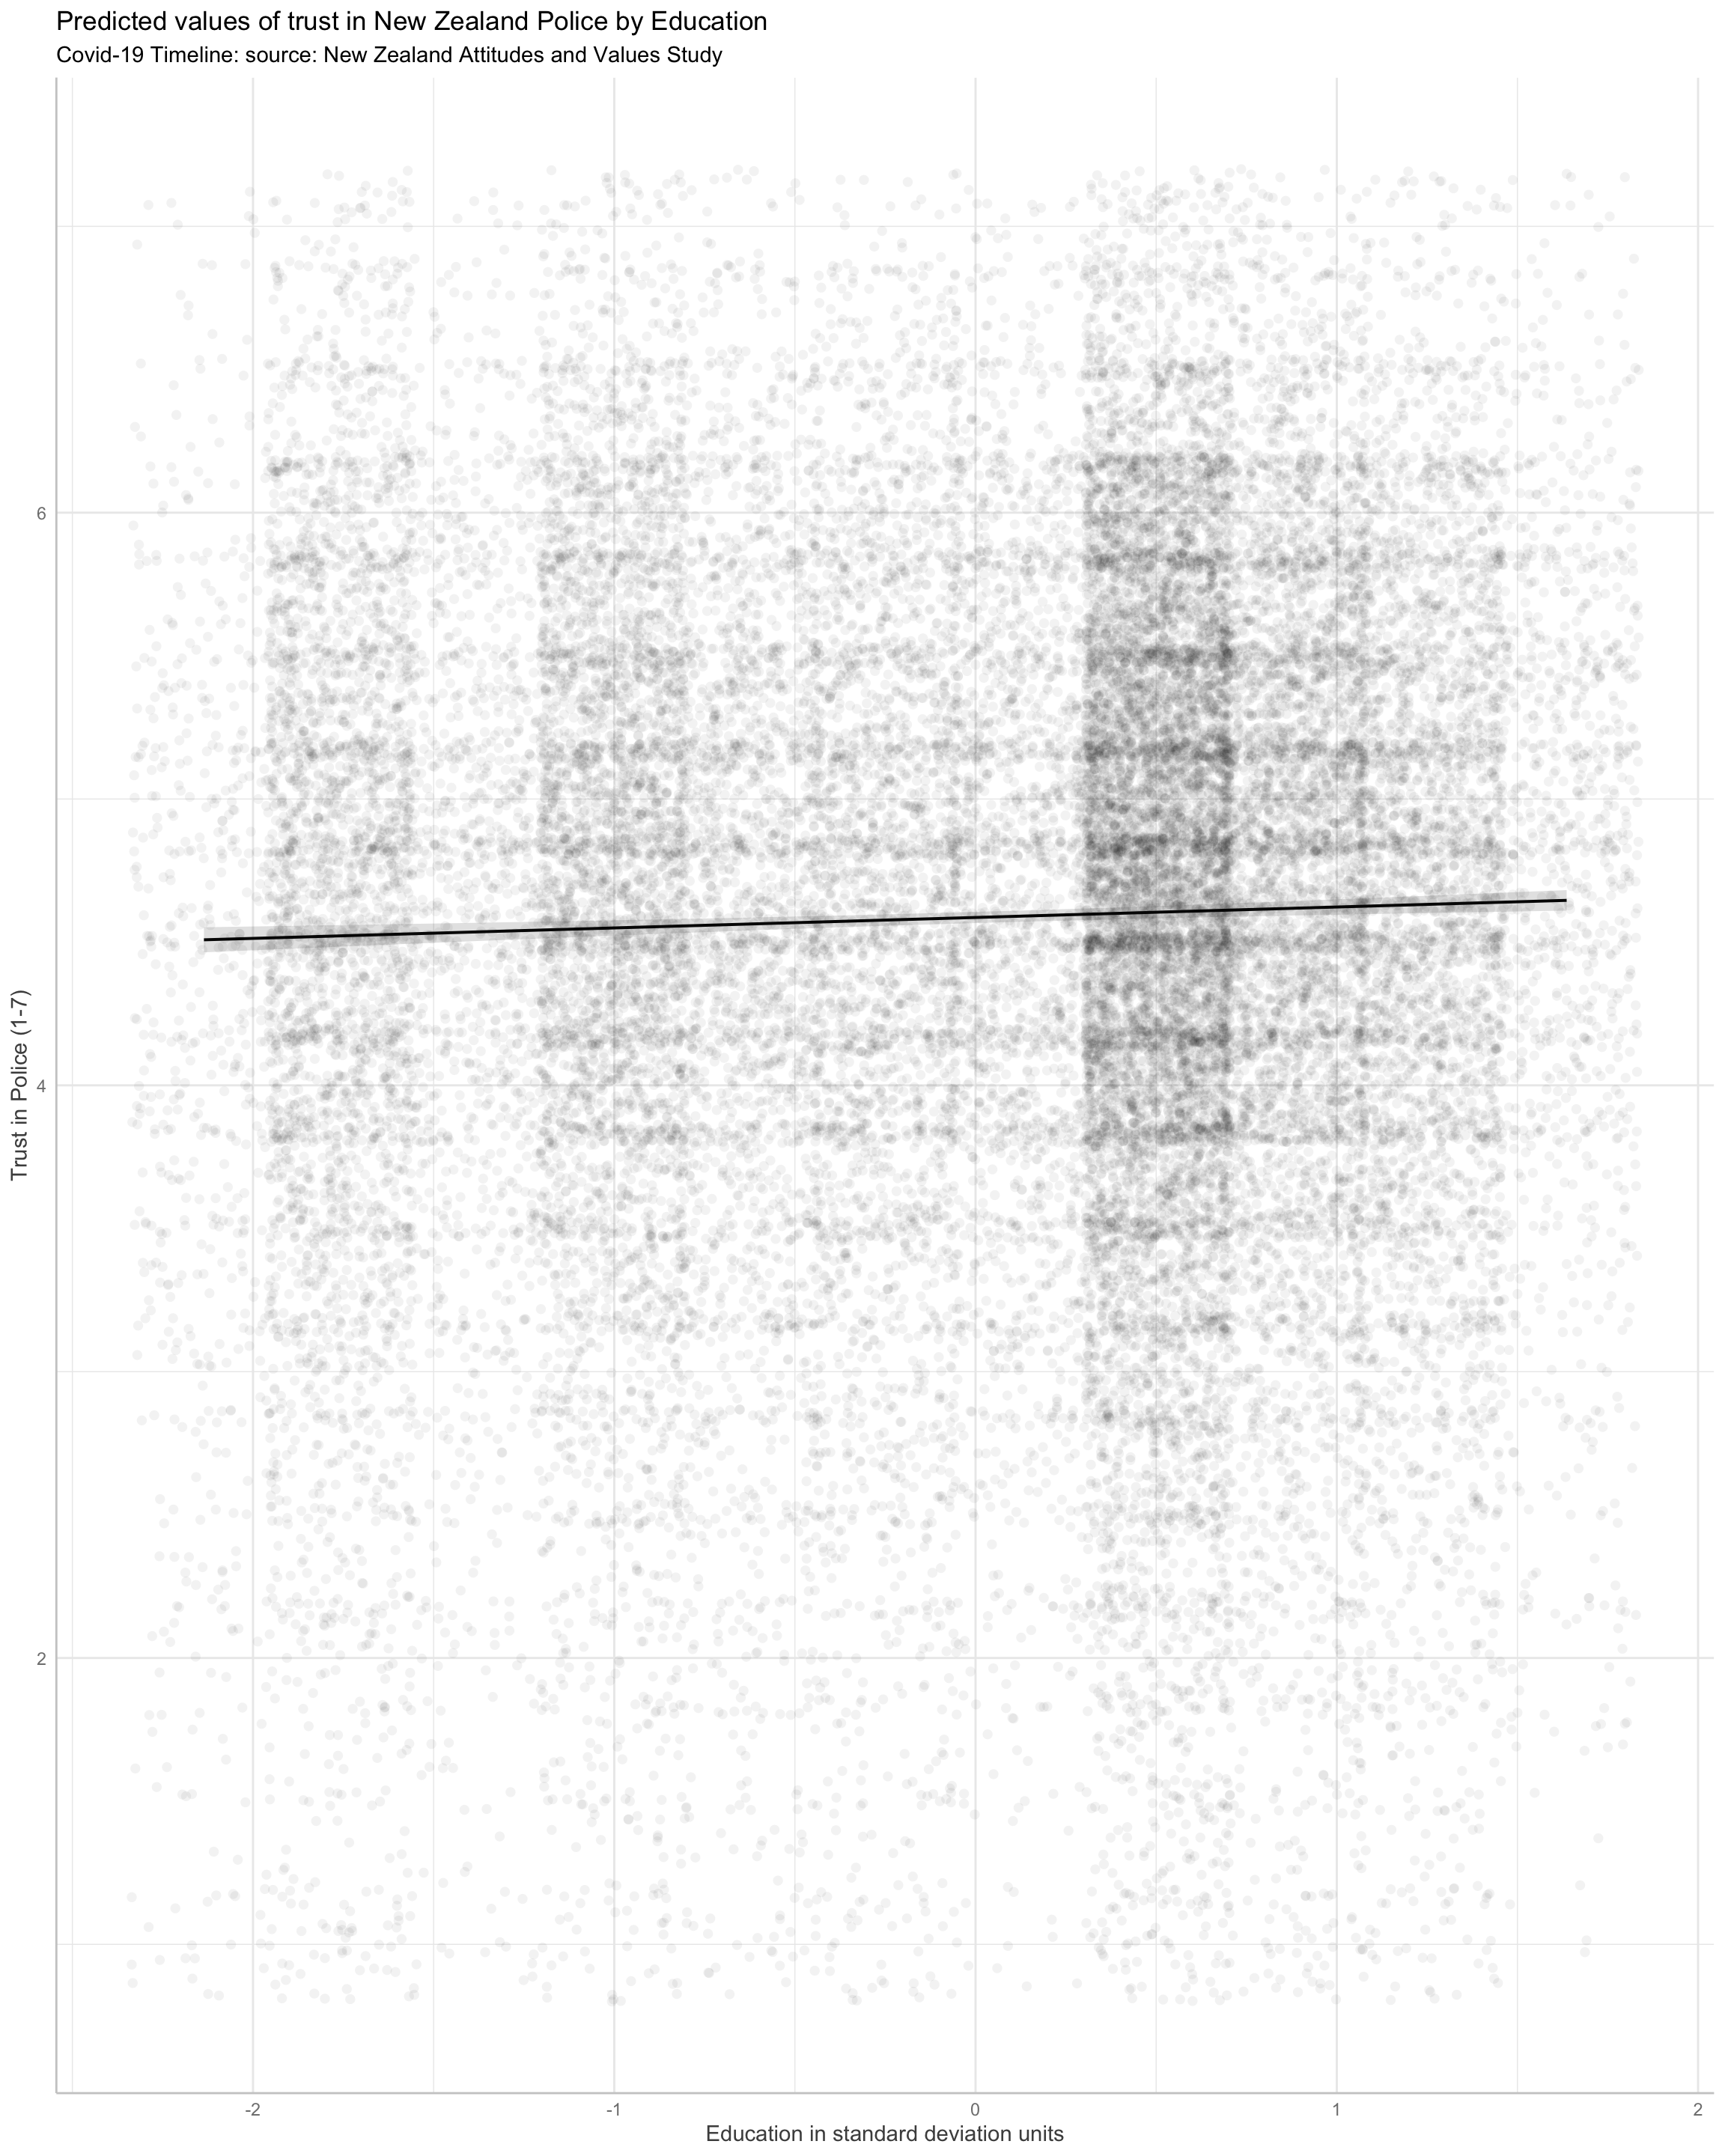
Trust in police predicted by education (standardised)
Education only weakly predicts greater trust in the police.
Show code
pt7 <-
  lme4::lmer(Police_Trust ~ Education_S + year_s  + (1 | Id), data = pd)

pt7_b <- plot(
  ggeffects::ggpredict(pt7,
                       effects = c("Education_S")),
  add.data = TRUE,
  dot.alpha = .05
)[[1]] +
  xlab("Education in standard deviation units") +
  ylab("Trust in Police (1-7)") +
  labs(title = "Predicted values of trust in New Zealand Police by Education ",
       subtitle = "Covid-19 Timeline: source: New Zealand Attitudes and Values Study")
pt7_b
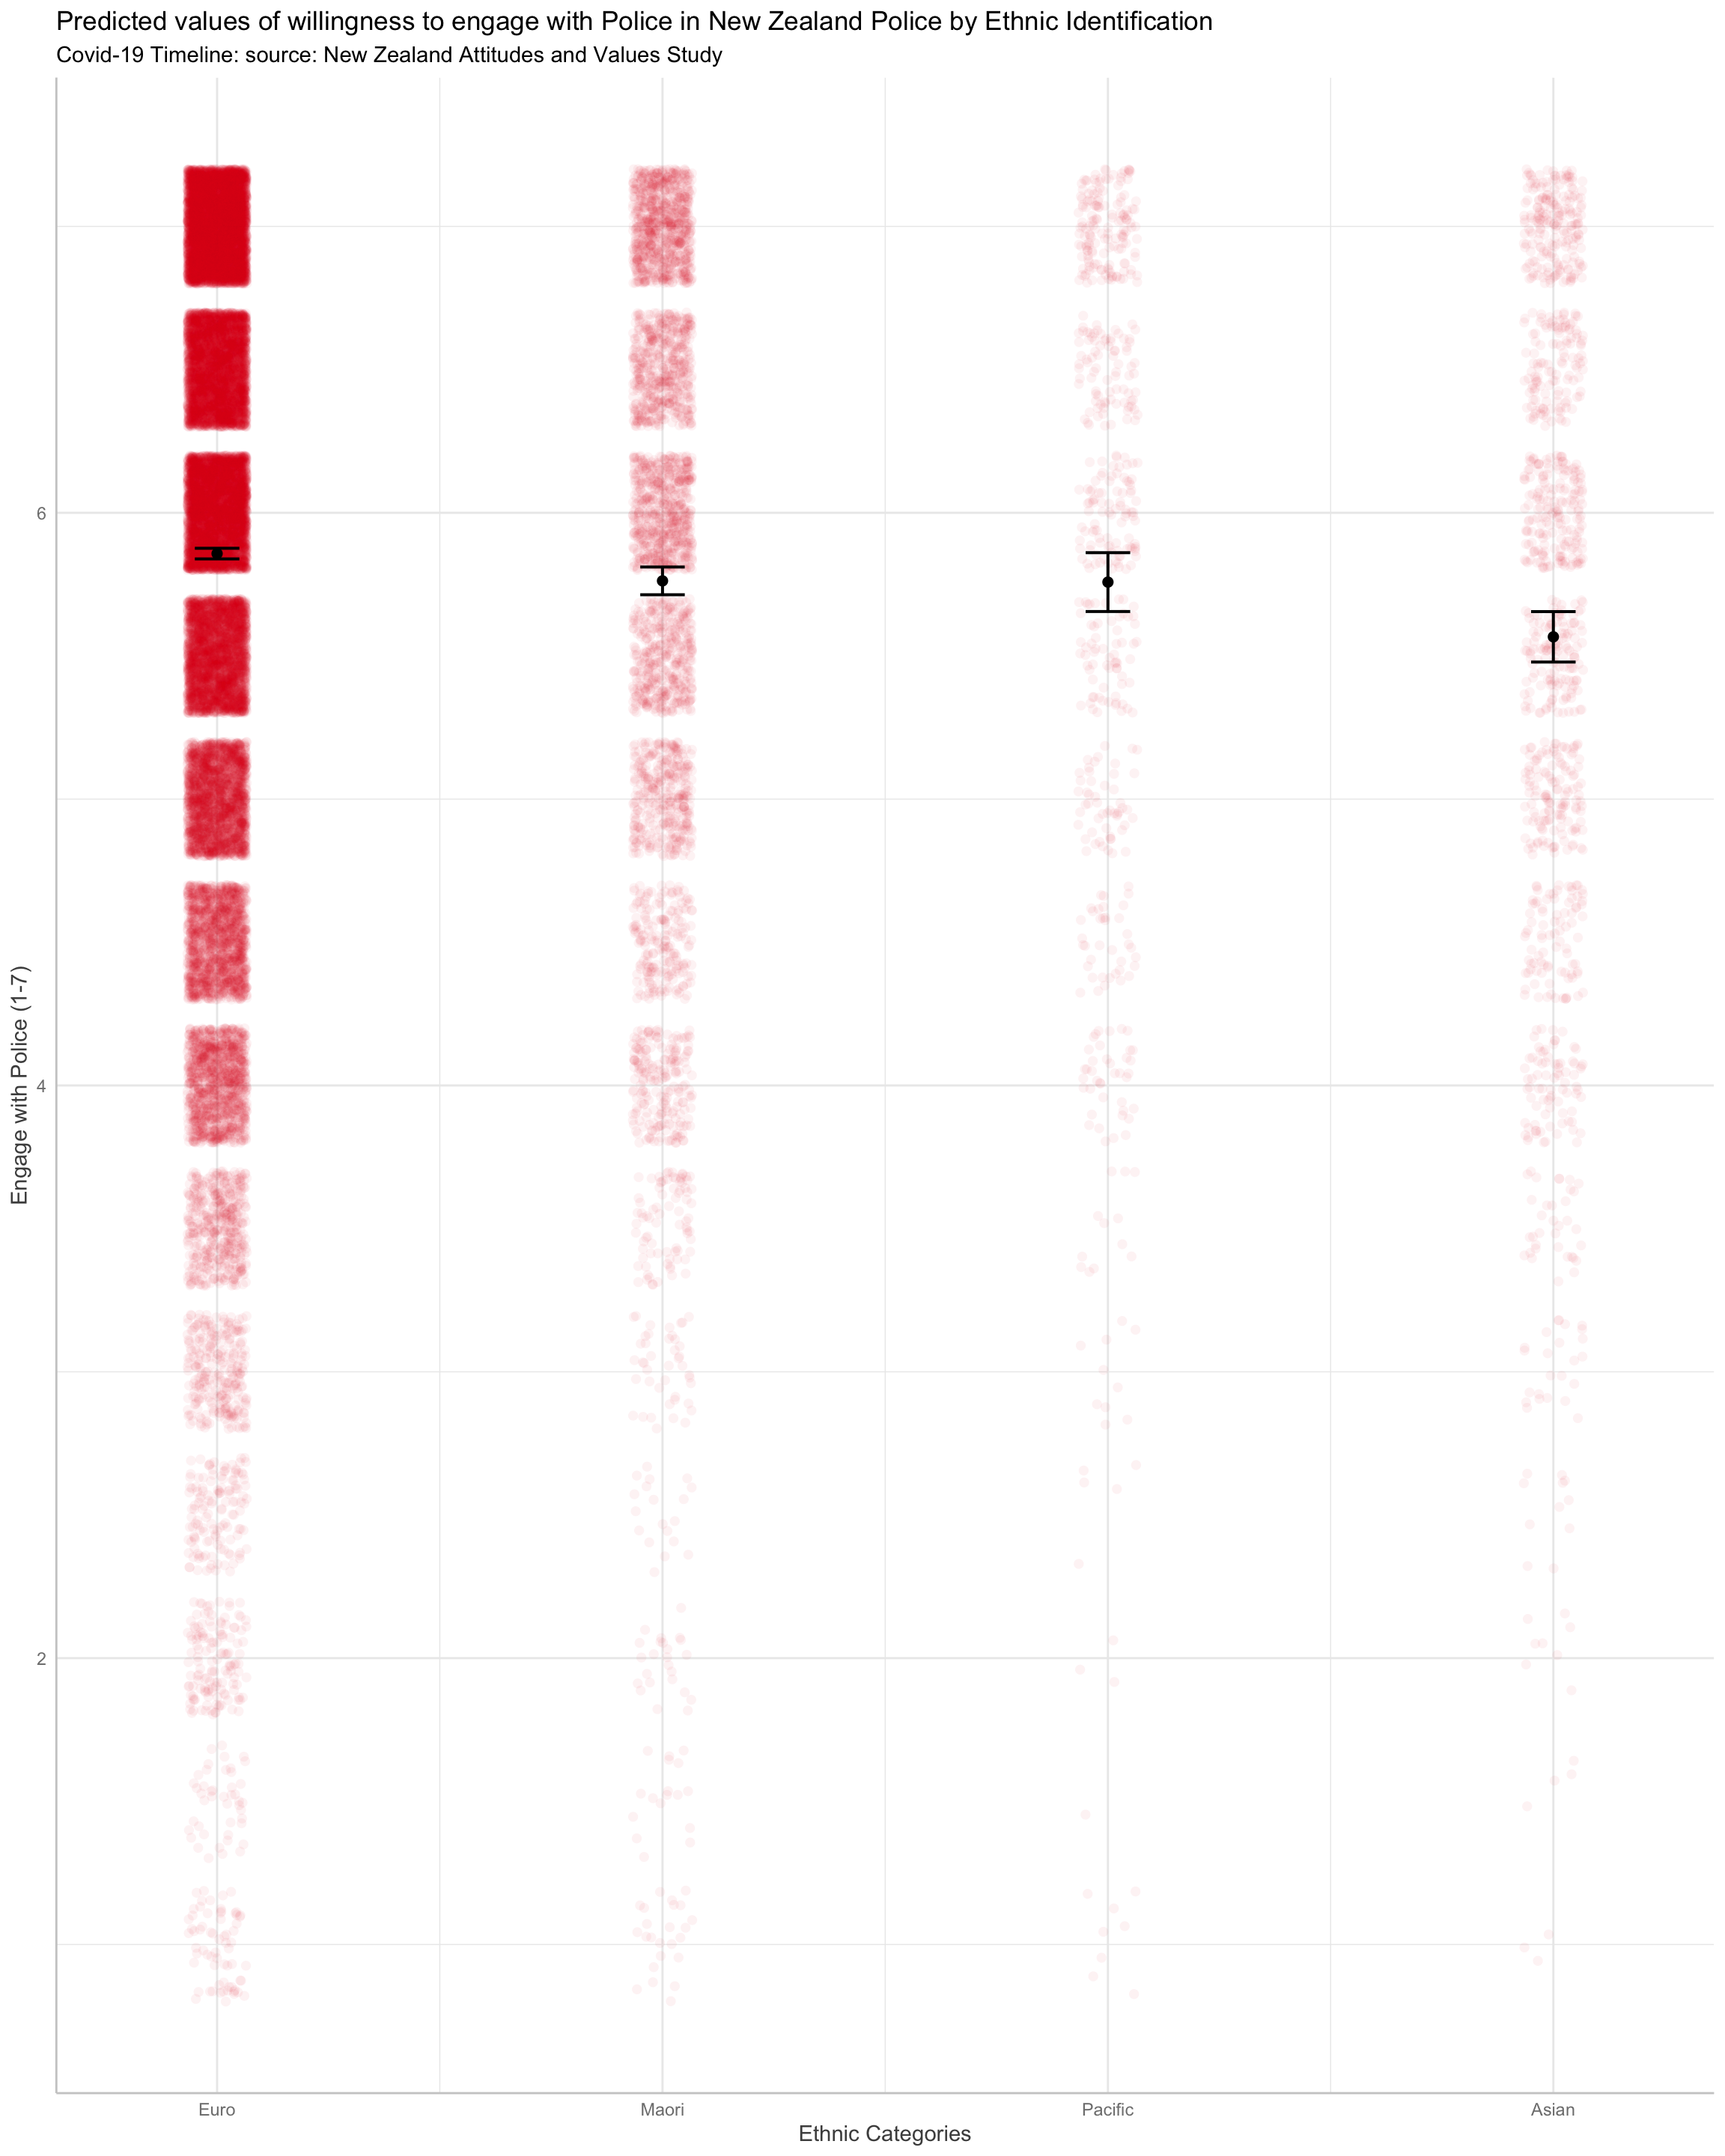
Willingness to engage with the police predicted by ethnic identification
Asians are less willing to engage the police, on average, than are other ethnic groups.
Show code
pt41 <-
  lme4::lmer(Police_Engage ~ Ethnic_Categories + year_s  + (1 | Id), data = pd)

pt4_b1 <- plot(
  ggeffects::ggpredict(pt41,
                       effects = c("Ethnic_Categories")),
  add.data = TRUE,
  dot.alpha = .05
)[[1]] +
  xlab("Ethnic Categories") +
  ylab("Engage with Police (1-7)") +
  labs(title = "Predicted values of willingness to engage with Police in New Zealand Police by Ethnic Identification",
       subtitle = "Covid-19 Timeline: source: New Zealand Attitudes and Values Study")
pt4_b1
Show code
#model_parameters(pt41)
Willingness to engage with the police predicted by gender identity
Those who identify as male are less willing to engage the police.
Show code
pt51 <-
  lme4::lmer(Police_Engage ~ Male + year_s + (1 | Id), data = pd)


pt5_b1 <- plot(
  ggeffects::ggpredict(pt51,
                       effects = c("Male")),
  add.data = TRUE,
  dot.alpha = .05
)[[1]] +
  xlab("Indentifies as Male") +
  ylab("Trust in Police (1-7)") +
  labs(title = "Predicted values of trust in New Zealand Police by Gender Identity",
       subtitle = "Covid-19 Timeline: source: New Zealand Attitudes and Values Study")
pt5_b1

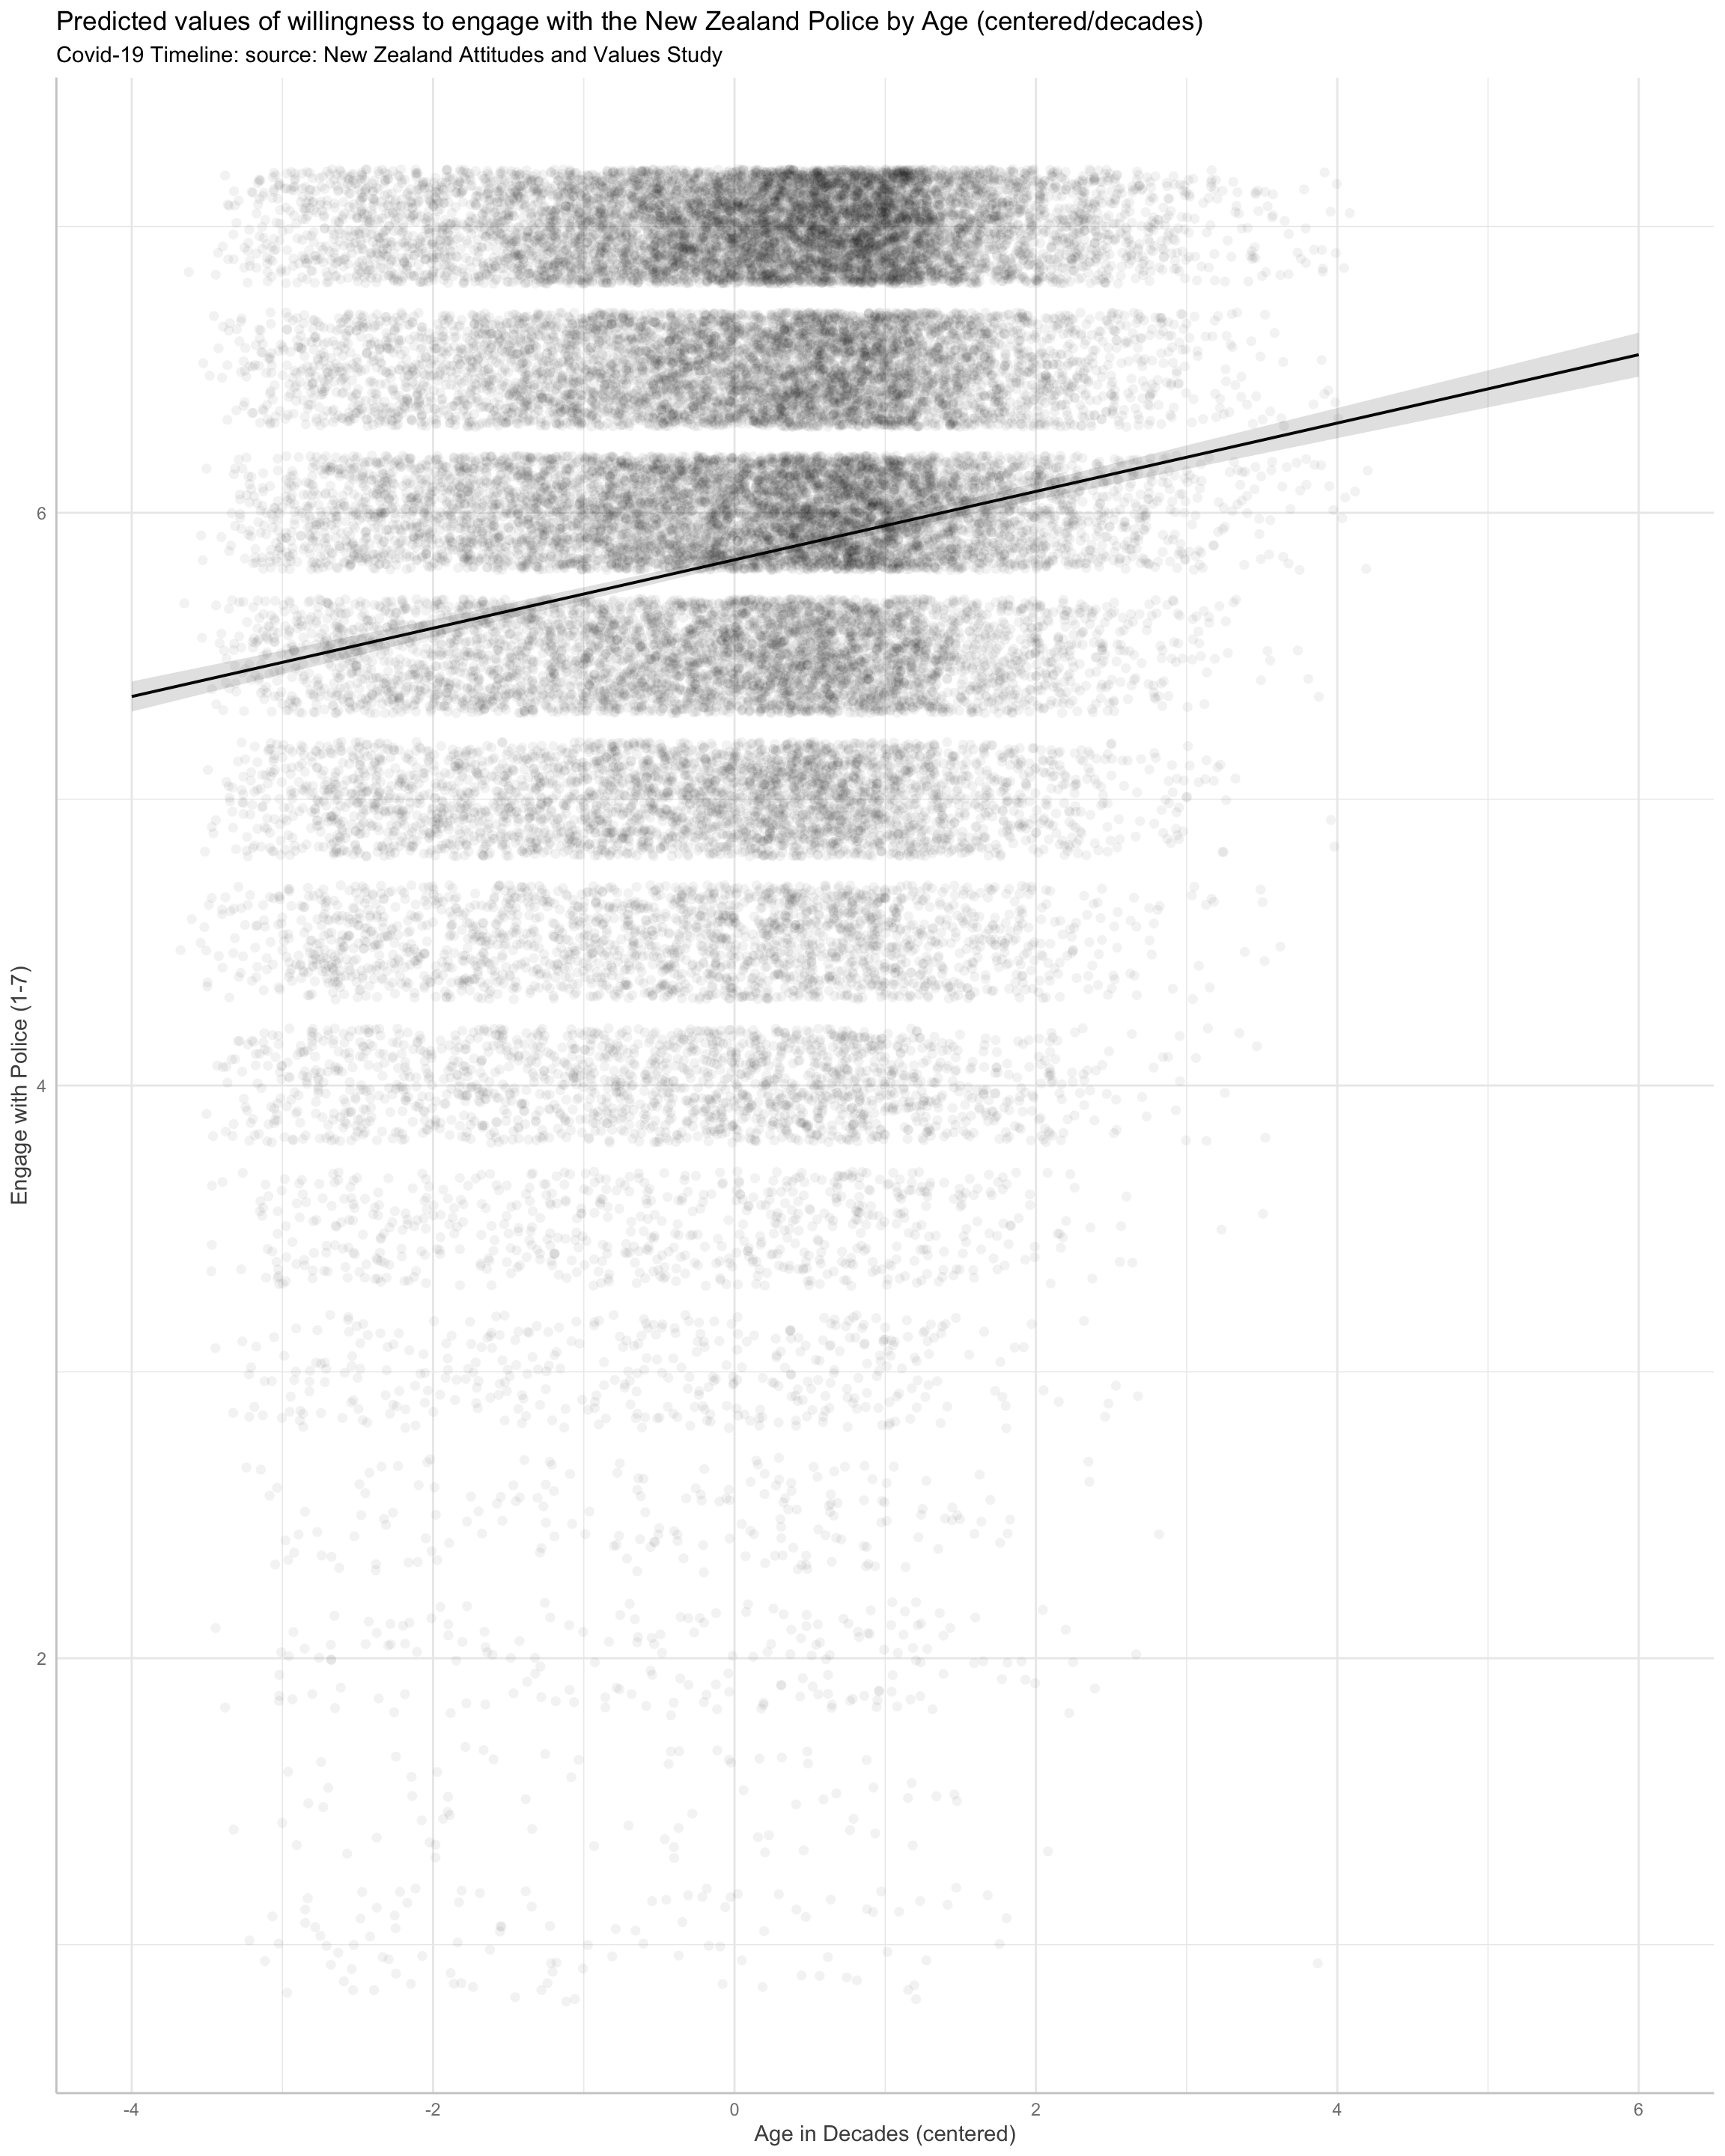
Willingness to engage with the police predicted by age
Older people are much more willing to engage the police.
Show code
pt61 <-
  lme4::lmer(Police_Engage ~ AgeDecadeC + year_s  + (1 | Id), data = pd)


pt6_b1 <- plot(
  ggeffects::ggpredict(pt61,
                       effects = c("Age")),
  add.data = TRUE,
  dot.alpha = .05
)[[1]] +
  xlab("Age in Decades (centered)") +
  ylab("Engage with Police (1-7)") +
  labs(title = "Predicted values of willingness to engage with the New Zealand Police by Age (centered/decades)",
       subtitle = "Covid-19 Timeline: source: New Zealand Attitudes and Values Study")
pt6_b1
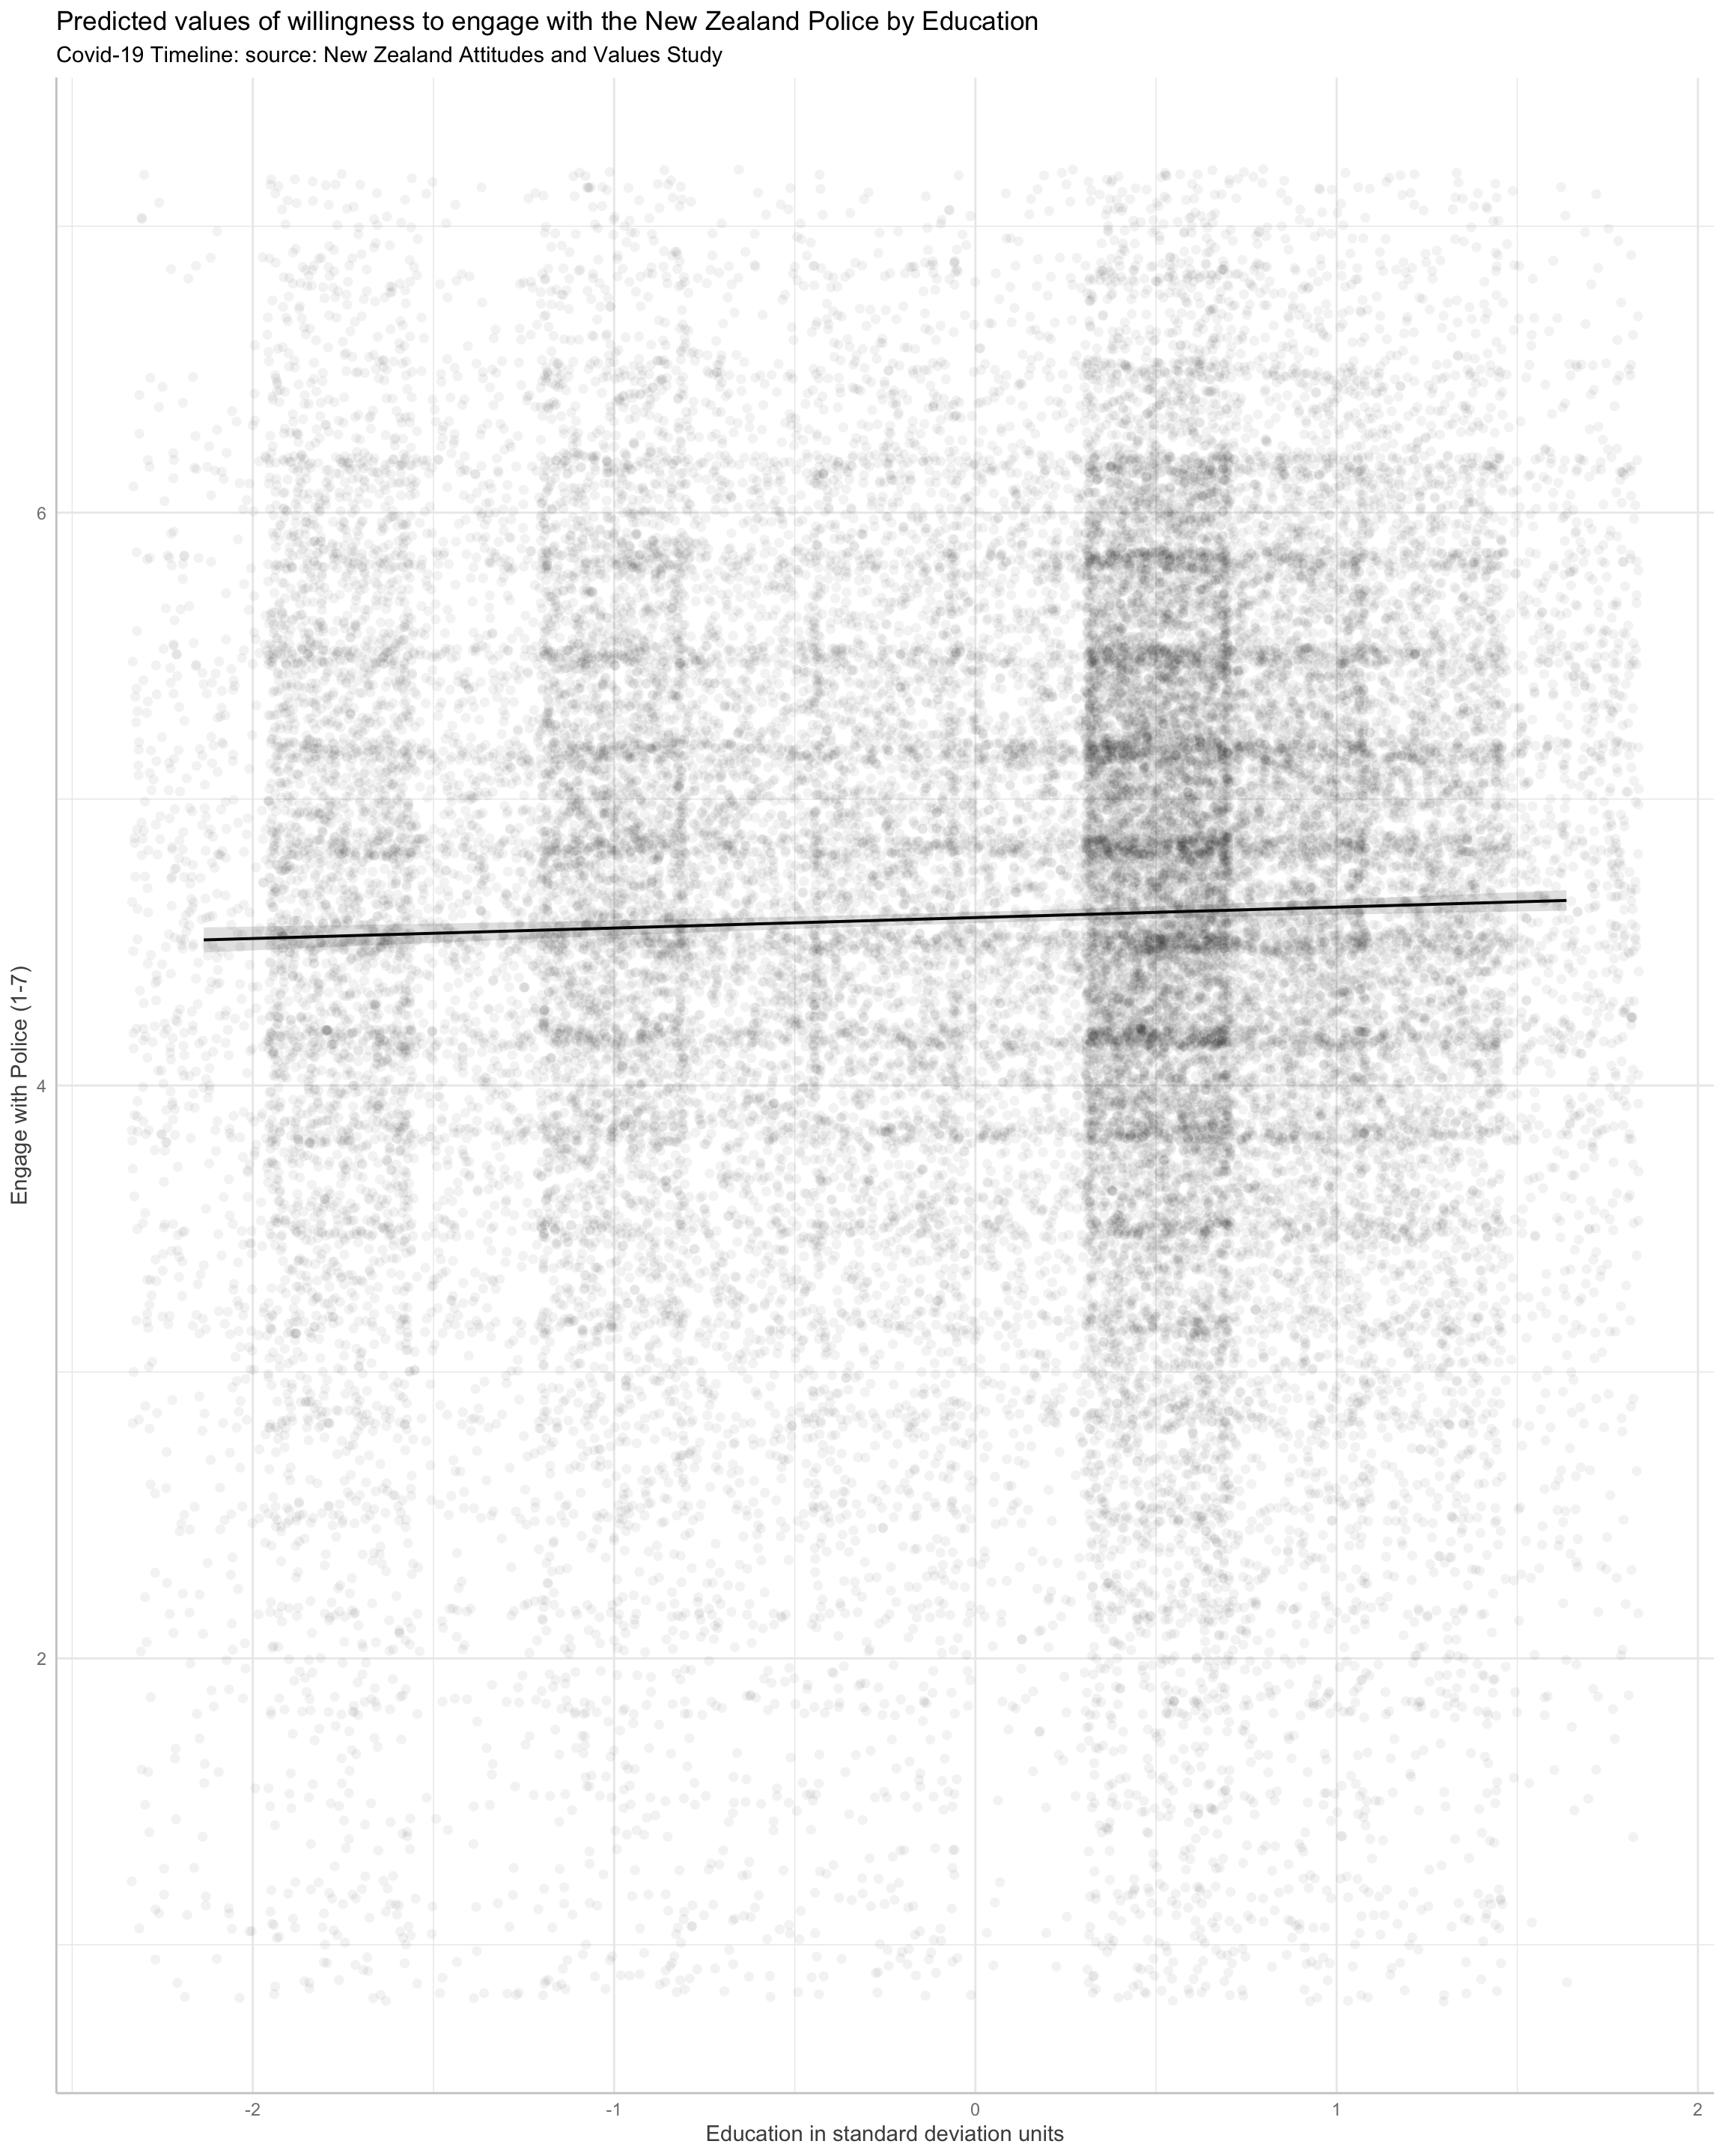
Willingness to engage with the police by education (standardised)
Educated people are slightly more willing to engage the police.
Show code
pt71 <-
  lme4::lmer(Police_Engage ~ Education_S + year_s  + (1 | Id), data = pd)

pt7_b1 <- plot(
  ggeffects::ggpredict(pt7,
                       effects = c("Education_S")),
  add.data = TRUE,
  dot.alpha = .05
)[[1]] +
  xlab("Education in standard deviation units") +
  ylab("Engage with Police (1-7)") +
  labs(title = "Predicted values of willingness to engage with the New Zealand Police by Education ",
       subtitle = "Covid-19 Timeline: source: New Zealand Attitudes and Values Study")
pt7_b1
Sample information
The following table reports the means and standard deviations in responses to these item, as well as sample descriptive details.
Show code
table1::table1(
  ~ Age +
    Ethnic_Categories +
    Male +
    Household_income +
    Police_Trust +
    Police_Engage +
    Politicians_Trust | Wave,
  overall  = FALSE,
  data = pd
)
| 2017 (N=11482) |
2018 (N=11482) |
2019 (N=11482) |
|
|---|---|---|---|
| Age | |||
| Mean (SD) | 53.1 (13.6) | 54.1 (13.6) | 55.1 (13.6) |
| Median [Min, Max] | 54.9 [19.2, 94.4] | 55.9 [20.0, 95.5] | 56.9 [21.0, 96.5] |
| Ethnic_Categories | |||
| Euro | 9632 (83.9%) | 9641 (84.0%) | 9380 (81.7%) |
| Maori | 1198 (10.4%) | 1137 (9.9%) | 1323 (11.5%) |
| Pacific | 175 (1.5%) | 174 (1.5%) | 249 (2.2%) |
| Asian | 361 (3.1%) | 358 (3.1%) | 386 (3.4%) |
| Missing | 116 (1.0%) | 172 (1.5%) | 144 (1.3%) |
| Male | |||
| Not_Male | 7245 (63.1%) | 7247 (63.1%) | 7243 (63.1%) |
| Male | 4201 (36.6%) | 4205 (36.6%) | 4202 (36.6%) |
| Missing | 36 (0.3%) | 30 (0.3%) | 37 (0.3%) |
| Household_income | |||
| Mean (SD) | 114000 (93000) | 115000 (93700) | 118000 (107000) |
| Median [Min, Max] | 96000 [1.00, 2500000] | 98000 [1.00, 2500000] | 100000 [0, 3000000] |
| Missing | 225 (2.0%) | 211 (1.8%) | 791 (6.9%) |
| Police_Trust | |||
| Mean (SD) | 4.50 (1.16) | 4.57 (1.18) | 4.69 (1.20) |
| Median [Min, Max] | 4.67 [1.00, 7.00] | 4.67 [1.00, 7.00] | 4.67 [1.00, 7.00] |
| Missing | 203 (1.8%) | 3 (0.0%) | 5 (0.0%) |
| Police_Engage | |||
| Mean (SD) | 5.93 (1.05) | 5.85 (1.07) | 5.74 (1.14) |
| Median [Min, Max] | 6.00 [1.00, 7.00] | 6.00 [1.00, 7.00] | 6.00 [1.00, 7.00] |
| Missing | 529 (4.6%) | 341 (3.0%) | 8 (0.1%) |
| Politicians_Trust | |||
| Mean (SD) | 3.95 (1.42) | 3.79 (1.44) | 3.86 (1.44) |
| Median [Min, Max] | 4.00 [1.00, 7.00] | 4.00 [1.00, 7.00] | 4.00 [1.00, 7.00] |
| Missing | 416 (3.6%) | 200 (1.7%) | 178 (1.6%) |
Timeline
Number of response per Covid timeline condition. All responses within individuals were recorded in wave 9, wave 10, and in the five Covid phases of wave 11 (pre-Covid, after the WHO announcement on January 6, after the first community case in New Zealand: 28 February, Early March, Lockdown (March-April 2020, and Post Lockdown))
Show code
| Covid_Timeline | n |
|---|---|
| PreCOVID | 29336 |
| Jan_Feb_2020 | 1325 |
| Early_March_2020 | 1019 |
| Lockdown_2020 | 937 |
| Post_Lockdown_2020 | 1829 |
Timeline histogram presents counts of NZAVS responses per day in the repeated measures sample 2017-2020:
Show code
carep <- pd %>%
  dplyr::mutate(timeline = make_date(year = 2009, month = 6, day = 30) + TSCORE) %>%
  count(day = floor_date(timeline, "day")) %>%
dplyr::mutate(condition = ifelse(
    day < "2019-06-20" &
      day > "2018-07-10",
    "Wave_10",
    ifelse(
      day >= "2019-06-20" &
        day < "2020-01-06",
      "PreCOVID_wave11",
      ifelse(
        day >= "2020-01-06" & day < "2020-02-29",
        "Jan_Feb",
        ifelse(
          day >= "2020-02-29" & day < "2020-03-25",
          "Early_March",
          ifelse(
            day >= "2020-03-25" &
              day < "2020-04-28",
            "Lockdown",
             ifelse(
            day >= "2017-08-27" &
            day <= "2018-07-10",
            "Wave_9",
            "Post_Lockdown"
            )))))) )%>%
  dplyr::mutate(condition = forcats::fct_relevel(condition, ord_dates_class)) %>%
  arrange(day)

tline <- ggplot(carep, aes(day, n)) +
  geom_col(aes(fill = condition)) + scale_x_date(date_labels = "%b/%Y", limits = c(as.Date("2017-08-26"), as.Date("2020-10-15")))  + scale_y_continuous(limits = c(0, 650))  +
  xlab("NZAVS Waves 9, 10 and 11 daily counts: repeated measures year 2017-2020") + ylab("Counts of Responses")  + theme_classic() +   scale_fill_viridis_d()
## covid timeline
tline
