About the New Zealand Atitudes and Values Study
Show code
datrep <- df %>%
  dplyr::mutate(timeline = make_date(year = 2009, month = 6, day = 30) + TSCORE) %>%
  count(day = floor_date(timeline, "day")) %>%
  dplyr::mutate(Year = factor(ifelse(
    day < "2010-01-01",
    2009,
    ifelse(
      day < "2011-01-01",
      2010,
      ifelse(
        day < "2012-01-01",
        2011,
        ifelse(
          day < "2013-01-01",
          2012,
          ifelse(
            day < "2014-01-01",
            2013,
            ifelse(
              day < "2015-01-01",
              2014,
              ifelse(
                day < "2016-01-01",
                2015,
                ifelse(
                  day < "2017-01-01",
                  2016,
                  ifelse(
                    day < "2018-01-01",
                    2017,
                    ifelse(day < "2019-01-01", 2018,
                           ifelse(day < "2020-01-01", 2019, 2020))
                  )
                )
              )
            )
          )
        )
      )
    )
  ))) %>%
  arrange(day)

# create date lines
ceq <- as.Date("2011-02-22")
keq <- as.Date("2016-11-14")
ter <- as.Date("2019-03-15")
cov <- as.Date("2020-03-24")

# get number for dates
ceqD <- which(datrep$day %in% ceq)
keqD <- which(datrep$day %in% keq)
terD <- which(datrep$day %in% ter)
covD <- which(datrep$day %in% cov)


# create dates

d1 <- as.numeric(datrep$day[ceqD])
d2 <- as.numeric(datrep$day[keqD])
d3 <- as.numeric(datrep$day[terD])
d4 <- as.numeric(datrep$day[covD])

# create break points
cuts <-
  data.frame(
    Big_Events = c(
      "Christchurch Earthquake",
      "Kaikoura Earthquake",
      "Mosque Attacks",
      "Stringent COVID-19 LockDown"
    ),
    vals = c(d1, d2, d3, d4),
    stringsAsFactors = FALSE
  )


ggplot2::ggplot(datrep, aes(day, n)) +
  geom_col(aes(fill = Year)) + scale_x_date(date_labels = "%b/%Y")  +
  geom_vline(
    mapping = aes(xintercept = vals,
                  colour = Big_Events),
    data = cuts,
    linetype = "dashed",
    show.legend = TRUE
  )  +
  xlab("NZAVS daily counts") + ylab("Count of Responses") + ggtitle("New Zealand Attitudes and Values Study Daily Response Counts\n Years 2009-2020; N = 61,535")  + theme_classic()  +  scale_fill_viridis_d() + theme(legend.position = "top")
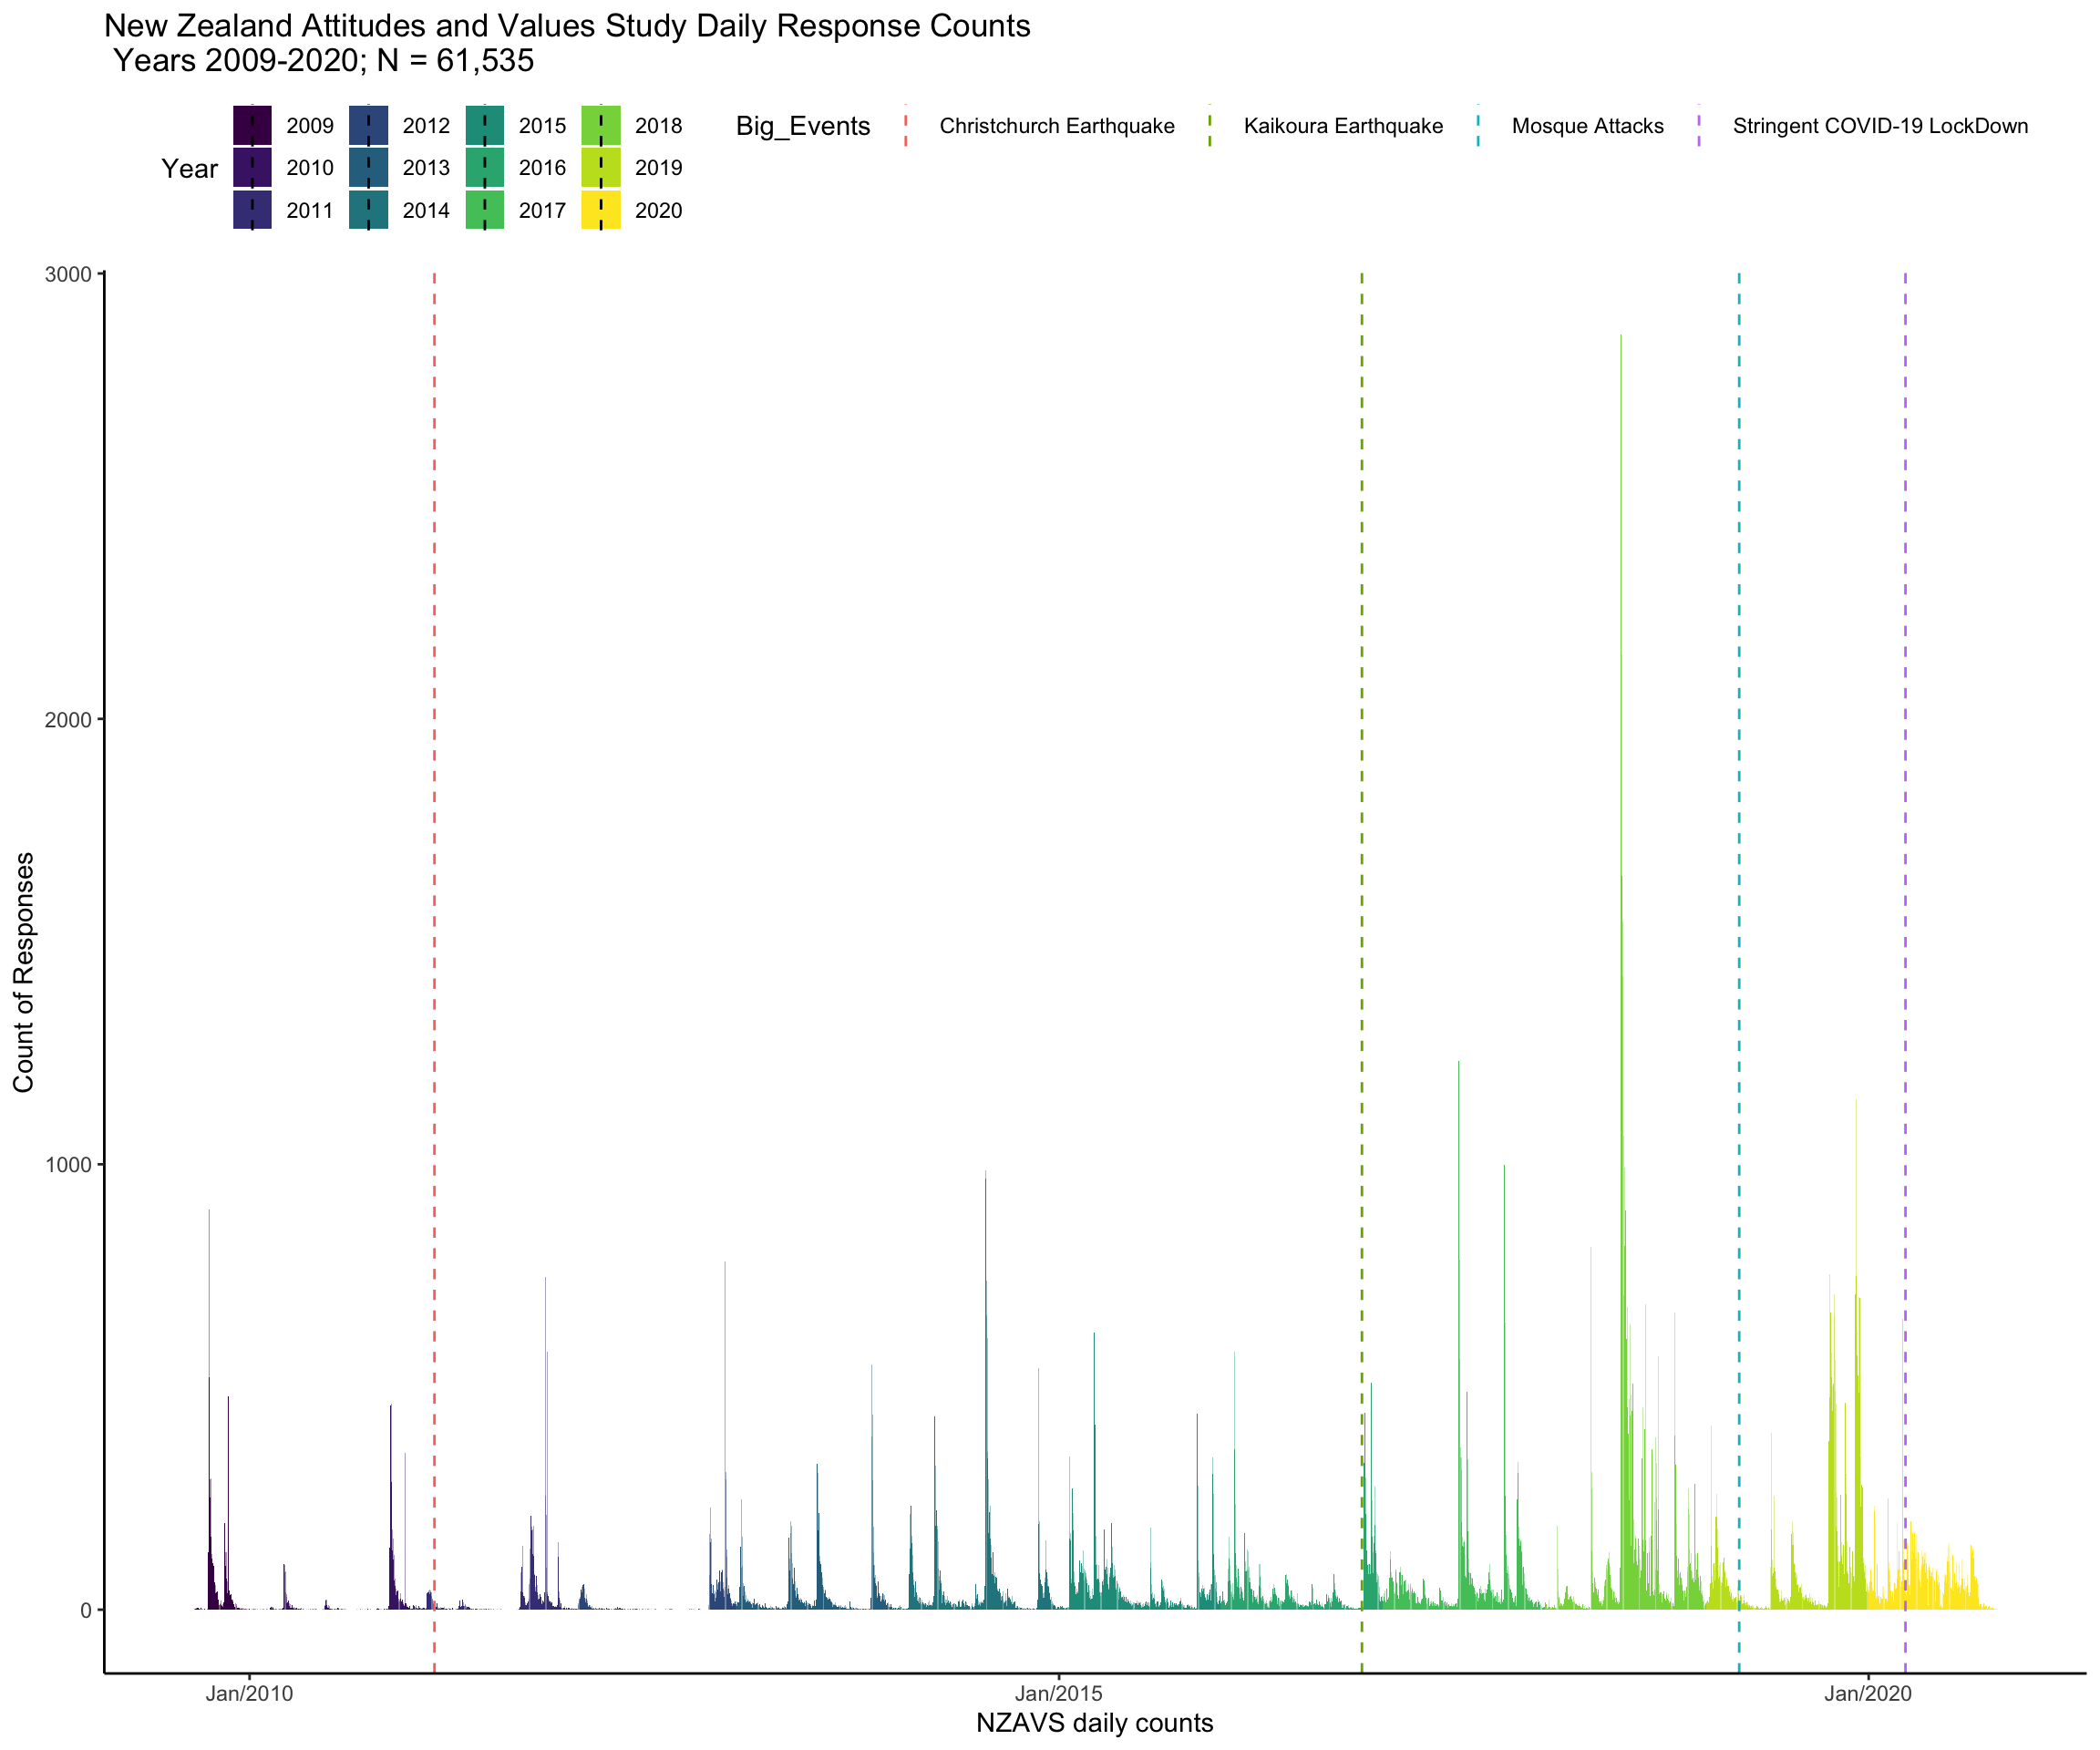
Figure 1: Sampling from the electoral rol combines with repeated measures within the same people across New Zealand’s social diversity to enable robust inference about stability and change in attitudes and values across New Zealand over time.
Show code
# another approach
# ggplot(datrep, aes(day, n)) +
#  # geom_col(aes(fill = Year)) + scale_x_date(date_labels = "%b/%Y")  +
#   geom_vline(
#     xintercept = as.numeric(datrep$day[ceqD]),
#     col = "red",
#     linetype = "dashed"
#   ) +
#   geom_vline(
#     xintercept = as.numeric(datrep$day[keqD]),
#     col = "red",
#     linetype = "dashed"
#   ) +
#   geom_vline(
#     xintercept = as.numeric(datrep$day[terD]),
#     col = "red",
#     linetype = "dashed"
#   ) +
#   geom_vline(
#     xintercept = as.numeric(datrep$day[covD]),
#     col = "red",
#     linetype = "dashed"
#   ) +
#   xlab("NZAVS daily counts") + ylab("Count of Responses") + ggtitle("NZAVS Daily Counts")  + theme_blank()  +  scale_fill_viridis_d()
The New Zealand Attitudes and Values Study (NZAVS) is a national panel study that Professor Chris G Sibley started in 2009. The team has since grown to over 40 collaborators.
A panel study is a longitudinal study that follows the same individuals over time. A panel study is different from a census, which samples the population as a whole over time, without tracking individuals.
The NZAVS maintains an up-to-date contact list as participants move house, change names, change telephone accounts, and change email addresses. The study’s personalised telephone campaigns, holiday cards, and participant prize draws have enabled the NZAVS to maintain a remarkably high annual sample retention rate of 80%. (Many longitudinal studies achieve only 20% retention.)
Each year, the NZAVS surveys health, personality, relationships, employment, values, beliefs, and habits within the same people. The study has received responses from 61,535 New Zealanders. Its most recent wave (2019/20) received longitudinal responses from 36,524 New Zealanders. This is about 1% of New Zealand’s adult population. The NZAVS is distinct from other national panel studies for the breadth of its survey questions with broad coverage in political and social psychology, health, and religion/spirituality and for its temporal scale, which encompasses 12 longitudinal waves. Time-series data within the same individuals across a diverse population are powerful because they enable a systematic understanding of the complex interplay between human social and psychological processes that occur within people as they respond to consequential events in our lives (“natural experiments”) (2021).
Link to data dictionary and questions